Explore probabilities, control coin biases, and analyze detailed results with this interactive tool. Perfect for students, educators, and enthusiasts!
How to Use
- Set Flips: Enter the number of flips.
- Adjust Bias: Use the slider to control the chance of heads or tails.
- Start: Click "Start Flips" to simulate and view results.
- Sound: Click "Sound:On/Off" to turn on or off the coin flip sound.
- Reset Anytime: Click the "Reset Stats" button to clear all data and start fresh.
Scroll down for detailed statistics, FAQs, code examples, and resources to deepen your understanding of probability.
Coin Bias Control
Frequently Asked Questions (FAQ)
1. What is a fair coin?
A fair coin is one that has an equal chance (50%) of landing on either heads or tails when flipped. It is unbiased, meaning the outcomes are equally likely.
2. What is coin bias?
Coin bias refers to the tendency of a coin to favor one outcome (heads or tails) over the other. In the context of this simulator, you can adjust the bias to control the probability of landing on heads or tails.
3. What is the chance of getting heads or tails?
For a fair coin, the chance of getting heads or tails is 50%. For a biased coin, the chance depends on the level of bias applied.
4. How does probability work in coin flips?
Probability is a measure of the likelihood of an event. For coin flips, the probability of an outcome (heads or tails) is calculated as the number of favorable outcomes divided by the total number of possible outcomes. For a fair coin, each outcome has a probability of 0.5.
5. Can a coin be perfectly fair?
In theory, a coin can be perfectly fair, but in practice, manufacturing imperfections or environmental factors (like how it's flipped) might introduce slight biases.
6. What does streak mean in statistics?
A streak refers to a sequence of consecutive identical outcomes. For example, flipping heads three times in a row is a streak of three heads.
7. What is the Law of Large Numbers?
The Law of Large Numbers is a fundamental principle in probability and statistics. It states that as the number of trials or experiments increases, the average of the observed outcomes will get closer to the expected value. For example, if you flip a fair coin many times, the proportion of heads and tails will approach 50% over the long run, even if there are fluctuations in smaller sample sizes.
Simulating Coin Flips Programmatically
This section demonstrates how to simulate coin flips programmatically in Python, R, Java, and JavaScript. Each implementation highlights the process step-by-step, including analyzing probabilities and visualizing results.
Python Implementation
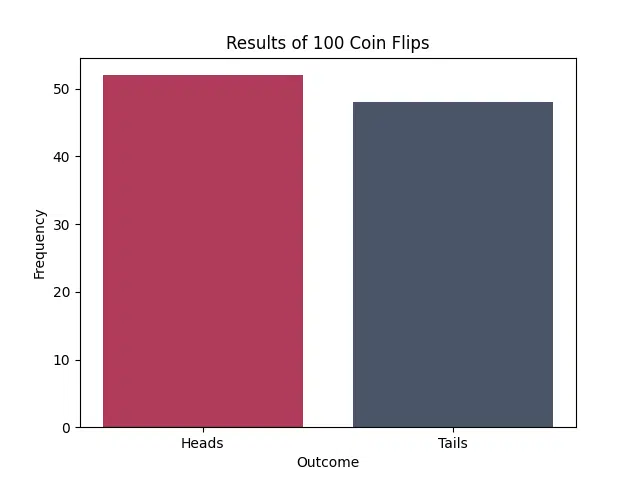
Python offers an easy way to simulate coin flips using the random module. The random.choice function selects a random element from a given list or sequence. For example, in simulating coin flips, random.choice(['Heads', 'Tails']) randomly selects either 'Heads' or 'Tails' with equal probability. Here's how to do it:
import random
import matplotlib.pyplot as plt

# Function to simulate coin flips
def simulate_coin_flips(num_flips):
    return [random.choice(['Heads', 'Tails']) for _ in range(num_flips)]

# Example: Simulate 100 coin flips
num_flips = 100
flips = simulate_coin_flips(num_flips)
heads_count = flips.count('Heads')
tails_count = flips.count('Tails')

print(f"Heads: {heads_count}, Tails: {tails_count}")

# Visualizing the results
labels = ['Heads', 'Tails']
counts = [heads_count, tails_count]
plt.bar(labels, counts, color=['#b03b5a', '#4a5568'])
plt.title(f"Results of {num_flips} Coin Flips")
plt.xlabel("Outcome")
plt.ylabel("Frequency")
plt.show()
R Implementation
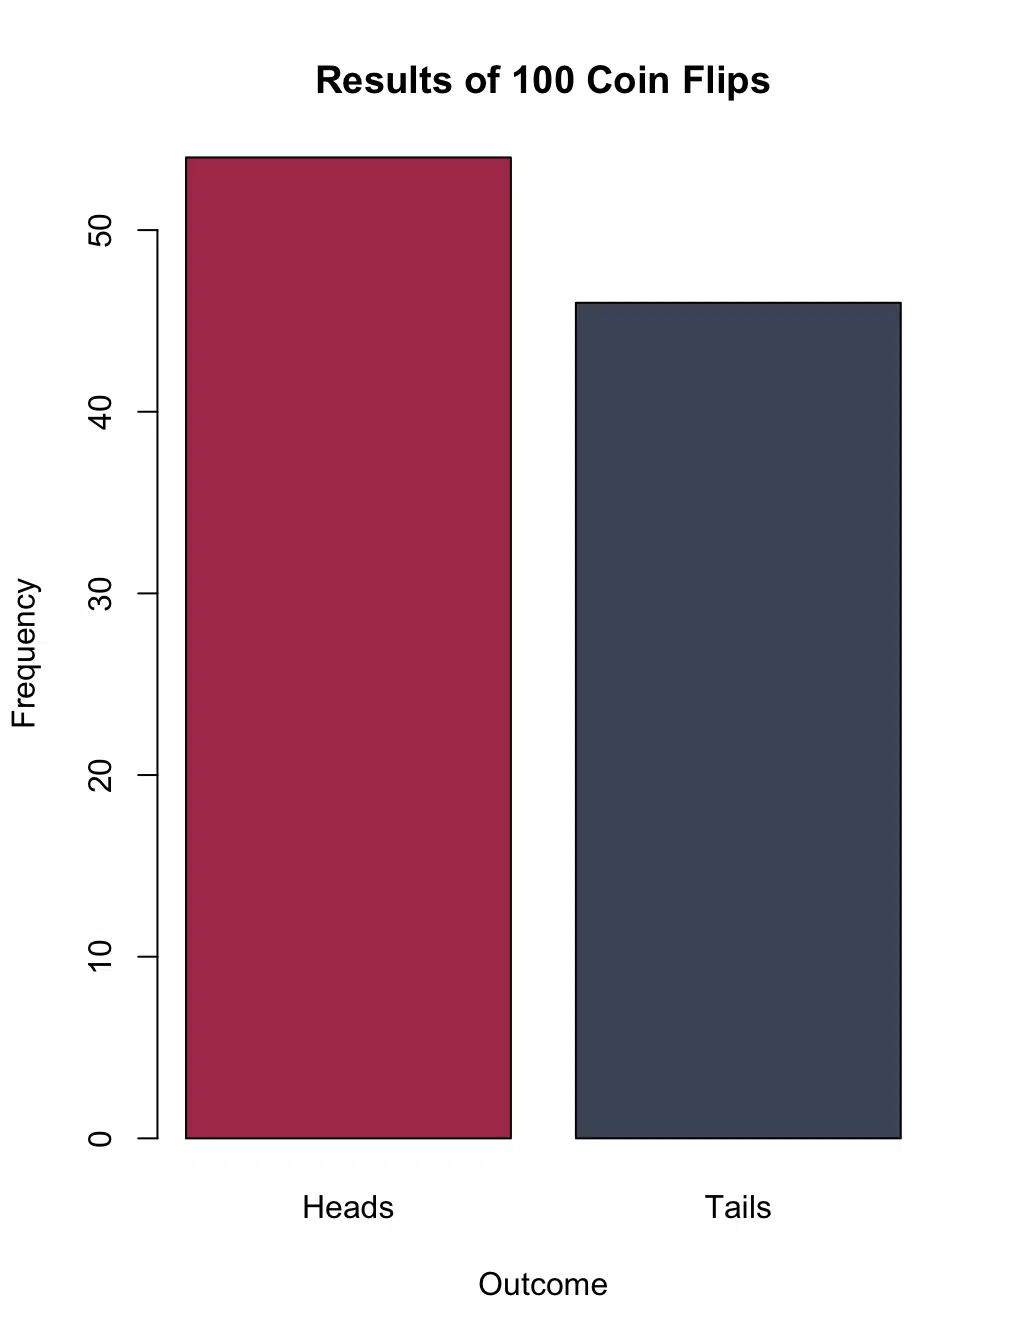
In R, you can use the sample function to simulate coin flips. The sample function selects random elements from a given vector, with or without replacement. For example, to simulate coin flips, you can use sample(c("Heads", "Tails"), num_flips, replace = TRUE), where num_flips specifies the number of flips, and replace = TRUE ensures that the outcomes are independent for each flip. Here's how to do it:
# Function to simulate coin flips
simulate_coin_flips <- function(num_flips) {
  sample(c("Heads", "Tails"), num_flips, replace = TRUE)
}

# Example: Simulate 100 coin flips
num_flips <- 100
flips <- simulate_coin_flips(num_flips)
heads_count <- sum(flips == "Heads")
tails_count <- sum(flips == "Tails")

cat("Heads:", heads_count, "\n")
cat("Tails:", tails_count, "\n")

# Visualizing the results
barplot(c(heads_count, tails_count),
        names.arg = c("Heads", "Tails"),
        col = c("#b03b5a", "#4a5568"),
        main = sprintf("Results of %d Coin Flips", num_flips),
        xlab = "Outcome",
        ylab = "Frequency")
Example Output:
Heads: 54Tails: 46

Further Reading
Explore more about the mathematics and probabilities behind coin flips with these carefully curated resources. They cover fundamental concepts, practical applications, and tools to deepen your understanding:
- The Research Scientist Pod Calculators - Discover calculators designed for probability, statistics, and advanced mathematical concepts.
- Flipism - Wikipedia - A quirky philosophical approach to decision-making based on coin flips.
- Coin Tossing - Wolfram MathWorld - A detailed mathematical analysis of probabilities in coin tossing.
- AnyDice: Probability Calculator - Use this tool to calculate probabilities for custom random events, including coin flips.
Whether you're studying statistics, experimenting with randomness, or simply curious about probabilities, these resources will enhance your understanding of coin flips and the mathematics behind them.
Attribution and Citation
If you found this guide and tools helpful, feel free to link back to this page or cite it in your work!
