Roll History
Frequently Asked Questions
1. How is the outcome of a dice roll determined?
A dice roll is an example of a random event where each side of the die has an equal probability of appearing. For instance, if you roll a six-sided die (d6), each number (1 through 6) has a probability of \( \frac{1}{6} \), assuming the die is fair and unbiased.
5. Are the die rolls random in real life and programmatically?
In real life, die rolls are considered random due to physical factors like the force applied, the angle of the throw, and air resistance. However, these factors are deterministic, meaning the outcome could theoretically be predicted if all variables were known and measured precisely.
Programmatically, die rolls rely on pseudorandom number generators (PRNGs), which produce sequences of numbers that mimic randomness but are generated through deterministic algorithms. While not truly random, modern PRNGs are sufficient for most applications, including dice simulations.
To learn more about randomness and pseudorandom number generation, visit our calculator: Random Number Generator.
2. What is the probability of rolling a specific number on a die?
The probability of rolling a specific number depends on the type of die. If the die has \( n \) sides, the probability of rolling any one specific number is \( \frac{1}{n} \). For example, on a twenty-sided die (d20), the probability of rolling any single number, say a 7, is \( \frac{1}{20} \), or 5%.
3. How do probabilities change when rolling multiple dice?
When rolling multiple dice, the individual probabilities of each die remain independent. However, the sum of the dice introduces a new distribution. For example, rolling two six-sided dice (2d6) creates a triangular distribution for the sum, with a peak at 7, because there are more ways to roll a 7 than any other number.
11. What does "d4", "d6", "d20", etc., mean?
The notation "dX" is shorthand used in games and probability to refer to a die with \( X \) sides. The "d" stands for "die" (singular) or "dice" (plural), and the number indicates how many faces the die has. For example:
- d4: A four-sided die, shaped like a tetrahedron.
- d6: A six-sided die, the classic cube shape commonly used in board games.
- d8: An eight-sided die, shaped like an octahedron.
- d10: A ten-sided die, often used for percentages (e.g., rolling two d10s for a result from 00 to 99).
- d12: A twelve-sided die, shaped like a dodecahedron.
- d20: A twenty-sided die, popular in tabletop RPGs like Dungeons & Dragons.
- d100: A hundred-sided die (rare) or a pair of d10s used to simulate 100 outcomes.
This nomenclature is widely used in tabletop games, role-playing games, and probability experiments for clarity and simplicity.
4. What is the difference between a uniform and a normal distribution?
A uniform distribution occurs when all outcomes have an equal chance of happening, such as rolling a single fair die. A normal distribution, on the other hand, is bell-shaped and arises when summing many independent random variables, like rolling multiple dice and adding the results. This is due to the Central Limit Theorem, which states that sums of random variables tend to form a normal distribution as the number of variables increases.
For examples of simulating and visualizing these distributions programmatically, refer to the Programmatic Dice Roll Simulation section below.
5. What is the average roll of a die?
The average, or expected value, of a single die roll can be calculated as the mean of its possible outcomes. For a die with \( n \) sides, the expected value is: \[ \text{Expected Value} = \frac{1 + n}{2} \] For example, for a six-sided die, the average roll is: \[ \frac{1 + 6}{2} = 3.5 \] This does not mean you will roll a 3.5, but over many rolls, the average result will approach this value.
6. How does rolling multiple dice affect the average?
When rolling multiple dice, the average, or expected value, of the total is simply the sum of the individual expected values. For example, rolling two six-sided dice (2d6), each with an average of 3.5, gives: \[ \text{Total Expected Value} = 3.5 + 3.5 = 7 \] This helps us predict the likely outcomes over many trials.
7. What is the probability of rolling doubles?
Rolling doubles means both dice show the same number. For two six-sided dice, there are 6 doubles (e.g., 1-1, 2-2, etc.) out of 36 total outcomes. The probability is: \[ \frac{6}{36} = \frac{1}{6} \] This probability stays consistent regardless of the type of dice, as long as they have the same number of sides.
8. How does probability change for weighted dice?
Weighted dice deviate from fair dice because some sides are more likely to appear than others. The probabilities are no longer uniform. For example, if a six-sided die favors the number 6, its probability might increase to \( 30\% \), while other sides decrease accordingly. Calculating probabilities for weighted dice requires knowing the bias distribution.
9. Can I use dice rolls to learn about real-world probabilities?
Absolutely! Dice rolls are a great way to simulate simple random events and learn about probability and statistics. For example, they can model scenarios like random sampling, cumulative distributions, or even games of chance.
10. Why does the histogram look different each time?
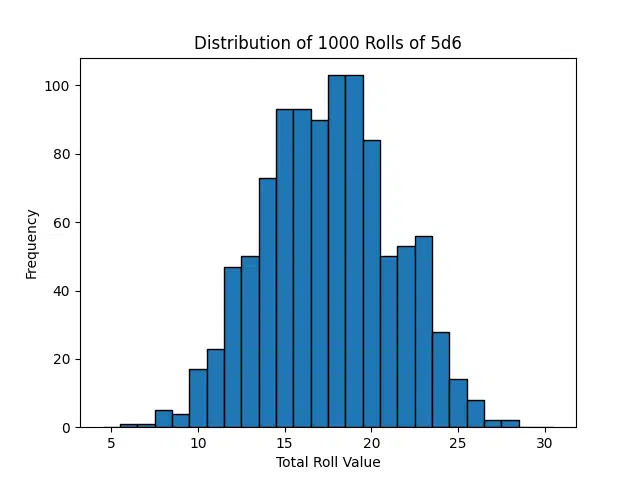
A histogram reflects the outcomes of your rolls and may vary because of randomness. Over many rolls, the histogram will begin to resemble the theoretical distribution. For a single die, this is uniform, while for sums of multiple dice, it approaches a triangular or normal distribution.
Simulating Dice Rolls Programmatically
This section demonstrates how to simulate dice rolls programmatically in Python, R, Java, and JavaScript. Each implementation highlights the process step-by-step, including how to analyze and visualize the results.
Python Implementation
Python provides a straightforward way to simulate and analyze dice rolls using its standard library and external libraries like matplotlib for visualization. Here's how to do it:
import random
import matplotlib.pyplot as plt

# Function to simulate rolling dice
def roll_dice(num_dice, sides):
    return [random.randint(1, sides) for _ in range(num_dice)]

# Example: Roll 5 six-sided dice
num_dice = 5
dice_sides = 6
rolls = roll_dice(num_dice, dice_sides)
total = sum(rolls)

print(f"Rolls: {rolls}")
print(f"Total: {total}")

# Simulating multiple rolls and analyzing distribution
num_rolls = 1000
totals = [sum(roll_dice(num_dice, dice_sides)) for _ in range(num_rolls)]

# Plotting the histogram of totals
plt.hist(totals, bins=range(num_dice, dice_sides * num_dice + 2), edgecolor='black', align='left')
plt.title(f"Distribution of {num_rolls} Rolls of {num_dice}d{dice_sides}")
plt.xlabel("Total Roll Value")
plt.ylabel("Frequency")
plt.show()
Example Output:
- Rolls: [6, 4, 6, 2, 5]
- Total: 23

R Implementation
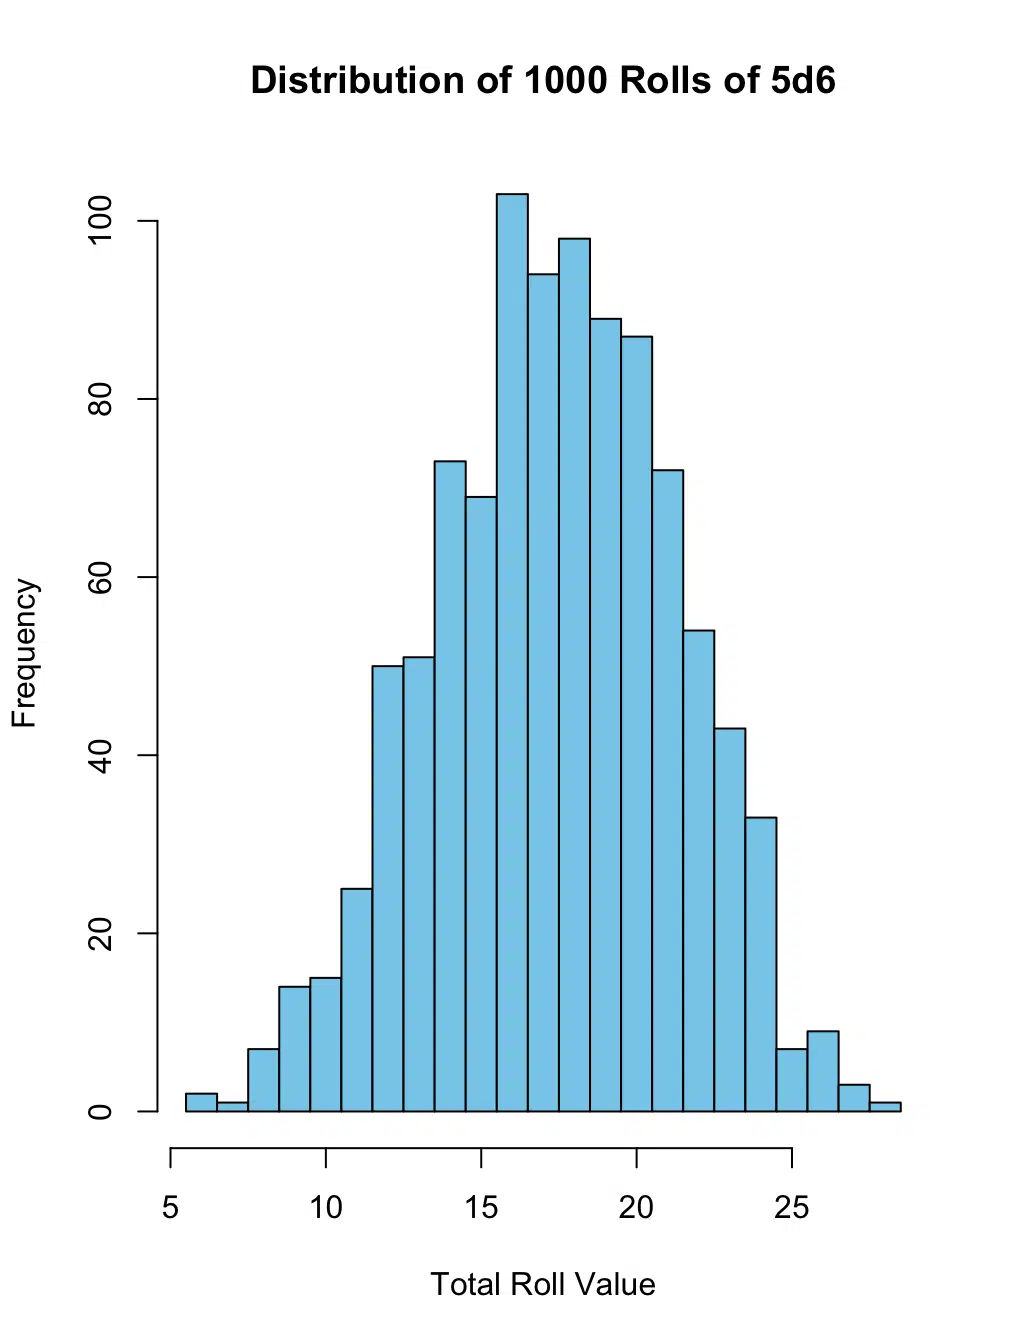
In R, you can use built-in functions like sample. Here's how to implement it:
# Function to simulate rolling dice
roll_dice <- function(num_dice, sides) {
  sample(1:sides, num_dice, replace = TRUE)
}

# Example: Roll 5 six-sided dice
num_dice <- 5
dice_sides <- 6
rolls <- roll_dice(num_dice, dice_sides)
total <- sum(rolls)

cat("Rolls:", rolls, "\n")
cat("Total:", total, "\n")

# Simulating multiple rolls and analyzing distribution
num_rolls <- 1000
totals <- replicate(num_rolls, sum(roll_dice(num_dice, dice_sides)))

# Plotting the histogram of totals
hist(totals, breaks = seq(min(totals) - 0.5, max(totals) + 0.5, 1),
     col = "skyblue", main = sprintf("Distribution of %d Rolls of %dd%d", num_rolls, num_dice, dice_sides),
     xlab = "Total Roll Value", ylab = "Frequency", border = "black")
Example Output:
- Rolls: 4 1 2 3 4
- Total: 14

Further Reading
Dive deeper into the probabilities and mathematics behind dice rolling with these carefully selected resources. They cover fundamental concepts, practical examples, and tools for further exploration:
- Understanding the Central Limit Theorem (CLT) with Practical Examples - Discover how the CLT explains the emergence of normal distributions when summing multiple dice rolls.
- Dice - Wikipedia - Learn about the history, types, and probabilities of dice, including polyhedral dice.
- Dice Mathematics - Wolfram MathWorld - A detailed guide to the mathematical properties and probabilities of dice.
- AnyDice: Dice Probability Calculator - Use this interactive tool to calculate probabilities for custom dice rolls and distributions.
- The Research Scientist Pod Calculators - Discover a collection of calculators designed for statistical analysis, mathematics, and other advanced computations.
Whether you're a gamer, a mathematician, or just curious, these resources will enhance your understanding of dice probabilities and their fascinating mathematical foundations.
Attribution and Citation
If you found this guide and tools helpful, feel free to link back to this page or cite it in your work!
