Frequently Asked Questions
1. How does the list randomizer work?
The list randomizer uses the Fisher-Yates (also known as Knuth) shuffle algorithm, which ensures each permutation of the list is equally likely to occur. This algorithm works by iterating through the list and swapping each element with a randomly chosen element that comes after it, creating an unbiased shuffle of the items.
2. What's the difference between true randomness and pseudo-randomness?
True randomness comes from unpredictable physical processes, like atmospheric noise or radioactive decay. Our randomizer, like most computer programs, uses a pseudorandom number generator (PRNG). While not truly random, modern PRNGs are sophisticated enough to provide high-quality randomization for practical purposes like list shuffling.
3. How does duplicate removal work?
When duplicate removal is enabled, the tool creates a Set object from the input items. A Set automatically keeps only unique values. For example, if your list contains ["apple", "banana", "apple"], the Set will contain only ["apple", "banana"]. You can choose whether this comparison should be case-sensitive or case-insensitive using the options provided.
4. What's the purpose of the word analysis feature?
The word analysis feature helps you understand patterns in your data by showing: - Frequency of each item - Common patterns across items - Character type distribution - Length statistics This can be particularly useful when working with large datasets or when you need to clean and standardize your data.
5. Why is there a 100,000 item limit?
The limit exists to ensure optimal performance and prevent browser memory issues. While the randomizer could technically handle more items, processing very large lists might cause performance issues or crash some browsers. For most practical applications, 100,000 items is more than sufficient.
6. How are multi-word items handled?
Multi-word items (like "New York" or "San Francisco") are treated as single units when separated by commas or new lines. The tool is smart enough to recognize that these are single items rather than separate words. However, if you paste space-separated items without commas or new lines, you may need to manually format them first.
7. What do the different statistical measures mean?
The tool provides several statistical measures: - Mean: The average length or value of items - Median: The middle value when items are sorted - Frequency: How often each item appears - Pattern Distribution: Analysis of character types and formats These metrics help you understand the composition and structure of your data.
8. Can I use this for randomizing data for research?
Yes, this tool can be used for research purposes such as: - Randomizing participant orders - Creating random samples - Generating random assignments However, for critical research requiring cryptographic-level randomness, you should use specialized research tools or consult with statistical experts.
9. Why might I want to ignore case when removing duplicates?
Ignoring case when removing duplicates helps standardize your data. For example, "Apple", "APPLE", and "apple" would be considered the same item. This is particularly useful when working with user-generated data or when case differences aren't meaningful for your purposes.
Implementing List Randomization Programmatically
This section demonstrates how to implement list randomization in Python, JavaScript, and R. Each implementation shows how to shuffle lists, remove duplicates, and analyze the results. We'll explore different approaches and their implications for randomization quality and performance.
Python Implementation
Python provides a robust set of libraries for randomization and statistical analysis. This implementation showcases key features like in-place shuffling, duplicate removal, and frequency visualization:
- Initialization: The `ListRandomizer` class is initialized with options for handling duplicates and case sensitivity.
- Shuffling: Implements the Fisher-Yates shuffle algorithm for robust randomization.
- Analysis: Computes statistics such as the average string length, number of numeric items, and frequency distribution.
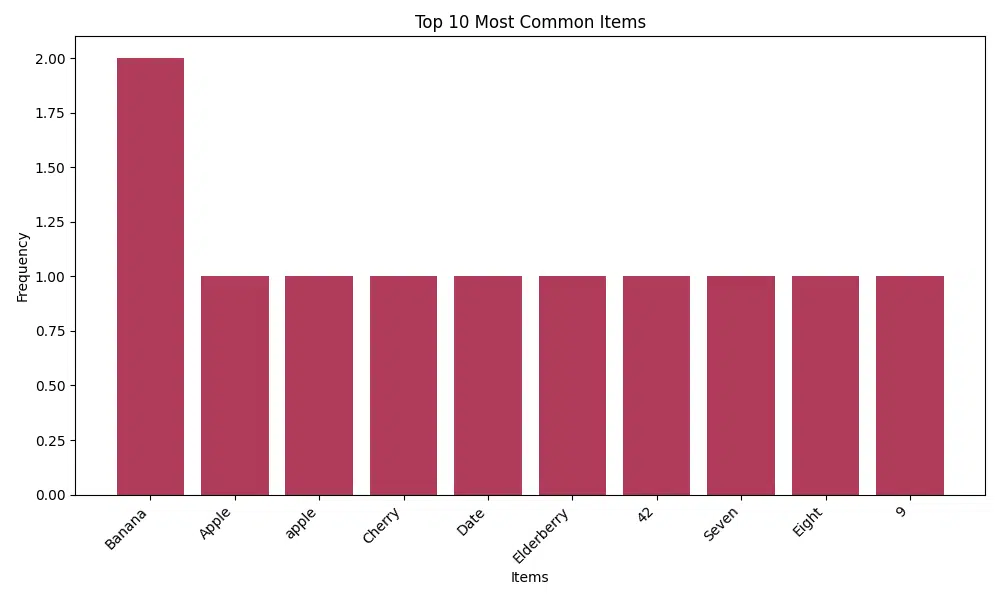
- Visualization: Generates a bar chart showing the frequency of the most common items.
import random
from collections import Counter
import statistics
import matplotlib.pyplot as plt

class ListRandomizer:
    def __init__(self, items, remove_duplicates=True, case_sensitive=True):
        """Initialize the randomizer with a list of items and options."""
        self.original_items = list(items)  # Store original input
        self.case_sensitive = case_sensitive
        self.processed_items = self._process_items(remove_duplicates)

    def _process_items(self, remove_duplicates):
        """Process items according to settings."""
        items = self.original_items.copy()

        # Handle case sensitivity
        if not self.case_sensitive:
            items = [str(item).lower() for item in items]

        # Remove duplicates if requested
        if remove_duplicates:
            items = list(dict.fromkeys(items))  # Preserve order while removing duplicates

        return items

    def shuffle(self):
        """Perform Fisher-Yates shuffle on the processed items."""
        items = self.processed_items.copy()
        for i in range(len(items) - 1, 0, -1):
            j = random.randint(0, i)
            items[i], items[j] = items[j], items[i]
        return items

    def analyze(self):
        """Analyze the list composition and patterns."""
        analysis = {
            'total_items': len(self.original_items),
            'unique_items': len(set(self.original_items)),
            'avg_length': statistics.mean(len(str(x)) for x in self.original_items),
            'numeric_items': sum(str(x).replace('.', '', 1).isdigit() for x in self.original_items),
            'frequency': Counter(self.original_items),
            'max_frequency': max(Counter(self.original_items).values()),
            'length_stats': {
                'min': min(len(str(x)) for x in self.original_items),
                'max': max(len(str(x)) for x in self.original_items),
                'median': statistics.median(len(str(x)) for x in self.original_items)
            }
        }
        return analysis

    def visualize_frequencies(self, top_n=10):
        """Create a bar plot of the most common items."""
        counter = Counter(self.original_items)
        most_common = counter.most_common(top_n)

        items, counts = zip(*most_common)
        plt.figure(figsize=(10, 6))
        plt.bar(range(len(counts)), counts, color='#b03b5a')
        plt.xticks(range(len(items)), items, rotation=45, ha='right')
        plt.title(f'Top {top_n} Most Common Items')
        plt.xlabel('Items')
        plt.ylabel('Frequency')
        plt.tight_layout()
        plt.show()

# Example usage
if __name__ == "__main__":
    sample_list = [
        "Apple", "Banana", "apple", "Cherry",
        "Date", "Banana", "Elderberry",
        "42", "Seven", "Eight", "9",
        "Cherry pie", "Apple pie"
    ]

    randomizer = ListRandomizer(
        sample_list,
        remove_duplicates=True,
        case_sensitive=False
    )

    shuffled = randomizer.shuffle()
    print("Shuffled list:", shuffled)

    analysis = randomizer.analyze()
    print("\nAnalysis:")
    for key, value in analysis.items():
        if key != 'frequency':
            print(f"{key}: {value}")

    print("\nVisualizing frequencies...")
    randomizer.visualize_frequencies()
Example Output:
Shuffled list: ['seven', 'cherry pie', 'banana', 'apple', 'apple pie', '42', 'elderberry', 'date', 'cherry', '9', 'eight']Analysis:
total_items: 13
unique_items: 12
avg_length: 5.6923076923076925
numeric_items: 2
max_frequency: 2
length_stats: {'min': 1, 'max': 10, 'median': 5}
Visualizing frequencies...

JavaScript Implementation
JavaScript provides robust array methods and the versatile `Math.random()` function for implementing list randomization. Here's a breakdown of the functionality:
- Initialization: The `ListRandomizer` class allows for easy customization using options for duplicate removal and case sensitivity.
- Shuffling: Uses the Fisher-Yates shuffle algorithm to ensure high-quality randomization.
- Analysis: Collects statistics like the total number of items, unique items, and their frequency distribution.
class ListRandomizer {
    constructor(items, options = {}) {
        const defaultOptions = {
            removeDuplicates: true,
            caseSensitive: true
        };
        this.options = { ...defaultOptions, ...options };
        this.originalItems = [...items];
        this.processedItems = this._processItems();
    }

    _processItems() {
        let items = [...this.originalItems];

        // Handle case sensitivity
        if (!this.options.caseSensitive) {
            items = items.map(item => String(item).toLowerCase());
        }

        // Remove duplicates if requested
        if (this.options.removeDuplicates) {
            items = [...new Set(items)];
        }

        return items;
    }

    // Fisher-Yates shuffle implementation
    shuffle() {
        const items = [...this.processedItems];
        for (let i = items.length - 1; i > 0; i--) {
            const j = Math.floor(Math.random() * (i + 1));
            [items[i], items[j]] = [items[j], items[i]];
        }
        return items;
    }

   analyze() {
        const items = this.originalItems;
        const frequencies = items.reduce((acc, item) => {
            acc[item] = (acc[item] || 0) + 1;
            return acc;
        }, {});

        const lengths = items.map(item => String(item).length);
        const average = arr => arr.reduce((a, b) => a + b, 0) / arr.length;
        const median = arr => {
            const sorted = [...arr].sort((a, b) => a - b);
            const mid = Math.floor(sorted.length / 2);
            return sorted.length % 2 ? sorted[mid] : (sorted[mid - 1] + sorted[mid]) / 2;
        };

        return {
            totalItems: items.length,
            uniqueItems: new Set(items).size,
            avgLength: average(lengths),
            numericItems: items.filter(item => !isNaN(item) && item.trim() !== '').length,
            frequencies,
            maxFrequency: Math.max(...Object.values(frequencies)),
            lengthStats: {
                min: Math.min(...lengths),
                max: Math.max(...lengths),
                median: median(lengths)
            }
        };
    }
}

// Example usage
const sampleList = [
    "Apple", "Banana", "apple", "Cherry",
    "Date", "Banana", "Elderberry",
    "42", "Seven", "Eight", "9",
    "Cherry pie", "Apple pie"
];

const randomizer = new ListRandomizer(sampleList, {
    removeDuplicates: true,
    caseSensitive: false
});

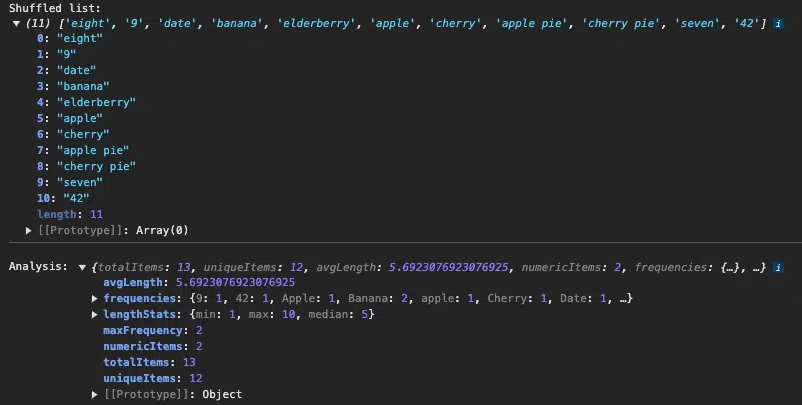
console.log("Shuffled list:", randomizer.shuffle());
console.log("\nAnalysis:", randomizer.analyze());
R Implementation
R provides a concise and powerful way to randomize lists and analyze their properties. Here's what this implementation does:
- Initialization: Stores the original list in an environment for further processing.
- Shuffling: Uses the `sample()` function to randomize items.
- Analysis: Computes frequencies and statistics like the average and median length of list items.
list_randomizer <- function(items, remove_duplicates = TRUE, case_sensitive = TRUE) {
  # Create an environment to store the original items
  .env <- new.env()
  .env$original_items <- items

  # Function to process items
  process_items <- function(items) {
    # Convert to character vector
    items <- as.character(items)

    # Handle case sensitivity
    if (!case_sensitive) {
      items <- tolower(items)
    }

    # Remove duplicates if requested
    if (remove_duplicates) {
      items <- unique(items)
    }

    return(items)
  }

  # Function to shuffle items
  shuffle <- function() {
    processed <- process_items(.env$original_items)
    sample(processed, length(processed))
  }

  # Function to analyze the list
  analyze <- function() {
    items <- .env$original_items
    frequencies <- table(items)
    lengths <- nchar(as.character(items))

    list(
      total_items = length(items),
      unique_items = length(unique(items)),
      avg_length = mean(lengths),
      numeric_items = sum(grepl("^[0-9]+$", items)),
      frequencies = frequencies,
      max_frequency = max(frequencies),
      length_stats = list(
        min = min(lengths),
        max = max(lengths),
        median = median(lengths)
      )
    )
  }

  # Return list of functions
  list(
    shuffle = shuffle,
    analyze = analyze
  )
}

# Example usage
sample_list <- c(
  "Apple", "Banana", "apple", "Cherry",
  "Date", "Banana", "Elderberry",
  "42", "Seven", "Eight", "9",
  "Cherry pie", "Apple pie"
)

# Create randomizer instance
randomizer <- list_randomizer(
  sample_list,
  remove_duplicates = TRUE,
  case_sensitive = FALSE
)

# Get shuffled list
shuffled <- randomizer$shuffle()
print("Shuffled list:")
print(shuffled)

# Get analysis
analysis <- randomizer$analyze()
print("\nAnalysis:")
print(analysis)
Example Output:
[1] "Shuffled list:"[1] "date" "cherry" "eight" "apple pie" "42" "9"
[7] "apple" "banana" "elderberry" "cherry pie" "seven"
[1] "\nAnalysis:"
$total_items
[1] 13
$unique_items
[1] 12
$avg_length
[1] 5.692308
$numeric_items
[1] 2
$frequencies
items
42 9 apple Apple Apple pie Banana Cherry
1 1 1 1 1 2 1
Cherry pie Date Eight Elderberry Seven
1 1 1 1 1
$max_frequency
[1] 2
$length_stats
$length_stats$min
[1] 1
$length_stats$max
[1] 10
$length_stats$median
[1] 5
Further Reading
If you're interested in learning more about list randomization and related concepts, check out the following resources:
- The Research Scientist Pod Calculators - Discover a collection of calculators designed for statistical analysis, mathematics, and other advanced computations.
- Python's Random Module Documentation - Official documentation for Python's `random` module, covering randomization techniques like `shuffle()`.
- JavaScript's Math.random() on MDN - A guide to using `Math.random()`, which is utilized in implementing the Fisher-Yates shuffle algorithm in JavaScript.
- R's Sample Function Documentation - Details on R's `sample()` function, a versatile tool for random sampling and shuffling.
- Fisher-Yates Shuffle Algorithm - A comprehensive explanation of the Fisher-Yates shuffle algorithm, used for unbiased randomization.
These resources provide deeper insights into the techniques and tools used in this implementation, helping you refine your understanding and skills.
Attribution and Citation
If you found this guide and tools helpful, feel free to link back to this page or cite it in your work!
