In Matplotlib, adjusting the position of axis labels is a quick way to improve your plot’s readability. To adjust the x-axis or y-axis label position, you can use the labelpad parameter in the xlabel() and ylabel() functions, or for more control, use set_label_coords() to set their coordinates manually. This post will guide you through both methods with easy-to-follow examples.
Adjusting X-axis Label Position
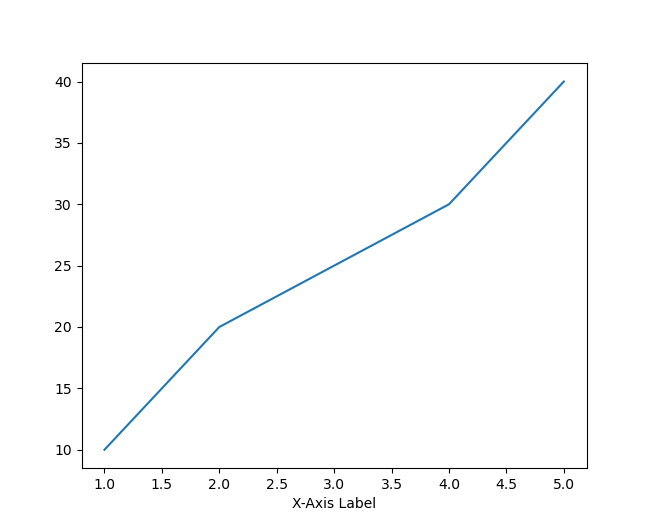
To adjust the position of the x-axis label, you can use the xlabel() function in combination with the labelpad parameter. The labelpad parameter allows you to move the label vertically. Here’s an example:
import matplotlib.pyplot as plt
# Sample data
x = [1, 2, 3, 4, 5]
y = [10, 20, 25, 30, 40]
# Create plot
plt.plot(x, y)
# Adding x-axis label with labelpad adjustment
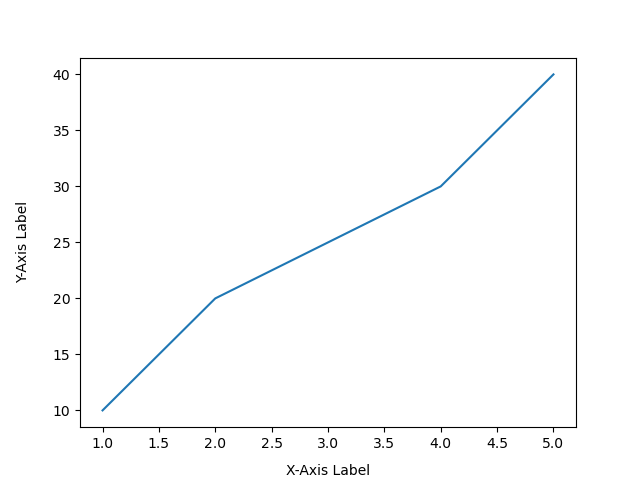
plt.xlabel('X-Axis Label') # No label adjustment
# Display the plot
plt.show()
import matplotlib.pyplot as plt
# Sample data
x = [1, 2, 3, 4, 5]
y = [10, 20, 25, 30, 40]
# Create plot
plt.plot(x, y)
# Adding x-axis label with labelpad adjustment
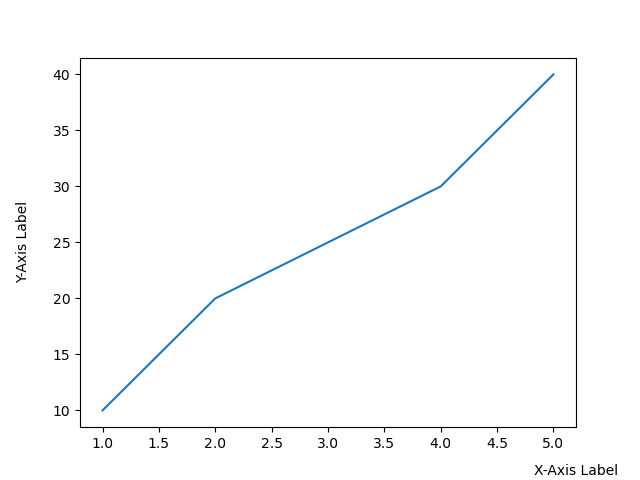
plt.xlabel('X-Axis Label', labelpad=20) # Moves label 20 points downwards
# Display the plot
plt.show()
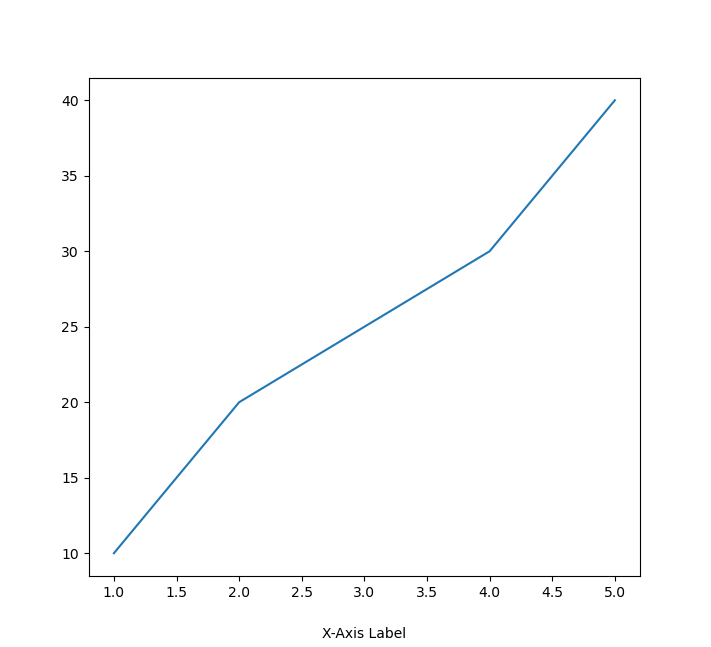
In this example, the x-axis label is moved 20 points downwards from its default position.
Adjusting the Y-axis Label Position
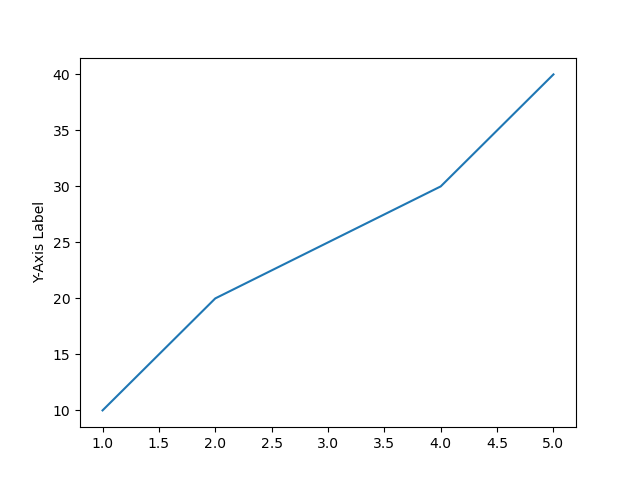
Similarly, you can adjust the y-axis label position by using the ylabel() function and labelpad to move the label horizontally. Here’s how:
import matplotlib.pyplot as plt

# Sample data
x = [1, 2, 3, 4, 5]
y = [10, 20, 25, 30, 40]

# Create plot
plt.plot(x, y)

# Adding y-axis label with labelpad adjustment
plt.ylabel('Y-Axis Label')  # No label adjustment

# Display the plot
plt.show()
import matplotlib.pyplot as plt

# Sample data
x = [1, 2, 3, 4, 5]
y = [10, 20, 25, 30, 40]

# Create plot
plt.plot(x, y)

# Adding y-axis label with labelpad adjustment
plt.ylabel('Y-Axis Label', labelpad=15)  # Moves label 15 points to the left

# Display the plot
plt.show()
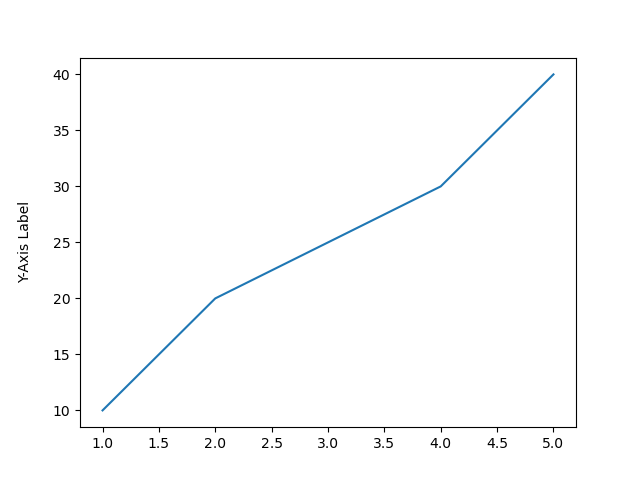
In this case, the y-axis label is moved 15 points to the left.
Using set_label_coords() for More Control
The labelpad parameter only moves the labels along one axis (x or y). However, if you want more fine-grained control, you can use the set_label_coords() method to move axis labels freely in both the horizontal and vertical directions.
Understanding the Coordinate System in set_label_coords()
The set_label_coords() method allows you to precisely position your axis labels using a coordinate system. This function accepts two arguments: the x-coordinate and the y-coordinate, which determine where the label will be placed relative to the axis.
The Coordinate System Breakdown
In Matplotlib, the coordinate system used by set_label_coords() is normalized, meaning the axis ranges from 0 to 1, regardless of the data limits:
- For the X-axis label:
- The x-coordinate ranges from
0to1, where:0places the label at the far left of the axis.1places the label at the far right of the axis.0.5centers the label horizontally along the axis.
- The y-coordinate controls the vertical position of the label relative to the x-axis. Typically, it is set to a negative value (e.g.,
-0.1) to move the label below the axis.
- The x-coordinate ranges from
- For the Y-axis label:
- The x-coordinate controls the horizontal position of the y-axis label. Typically, it is set to a negative value (e.g.,
-0.1) to move the label to the left of the axis. - The y-coordinate ranges from
0to1, where:0places the label at the bottom of the y-axis.1places the label at the top of the y-axis.0.5centers the label vertically along the y-axis.
- The x-coordinate controls the horizontal position of the y-axis label. Typically, it is set to a negative value (e.g.,
Example: set_label_coords() for More Control
Here’s how to use it:
import matplotlib.pyplot as plt

# Sample data
x = [1, 2, 3, 4, 5]
y = [10, 20, 25, 30, 40]

# Create plot
plt.plot(x, y)

# Adding x-axis label and adjusting its position
plt.xlabel('X-Axis Label')
ax = plt.gca()  # Get current axis
ax.xaxis.set_label_coords(0.5, -0.1)  # Move the label (x=0.5, y=-0.1)

# Adding y-axis label and adjusting its position
plt.ylabel('Y-Axis Label')
ax.yaxis.set_label_coords(-0.1, 0.5)  # Move the label (x=-0.1, y=0.5)

# Display the plot
plt.show()
Let’s adjust the x-axis label to the bottom right corner:
import matplotlib.pyplot as plt

# Sample data
x = [1, 2, 3, 4, 5]
y = [10, 20, 25, 30, 40]

# Create plot
plt.plot(x, y)

# Adding x-axis label and adjusting its position
plt.xlabel('X-Axis Label')
ax = plt.gca()  # Get current axis
ax.xaxis.set_label_coords(1, -0.1)  # Move the label (x=1, y=-0.1)

# Adding y-axis label and adjusting its position
plt.ylabel('Y-Axis Label')
ax.yaxis.set_label_coords(-0.1, 0.5)  # Move the label (x=-0.1, y=0.5)

# Display the plot
plt.show()
We can see by using (1, -0.1) adjusts the X-axis label to the bottom right of the plot
Summary
In Matplotlib, adjusting axis label positions is simple yet effective for improving plot readability. You can use the labelpad parameter to control the spacing between the labels and the axis, or you can use the set_label_coords() method for more precise control over the exact placement of the labels. By combining these two methods, you can customize the label positions to suit your needs—whether that’s centering, moving them closer or farther from the axis, or shifting them to prevent overlaps. These tools provide the flexibility needed to make your visualizations clear and professional.
Congratulations on reading to the end of this tutorial! For further reading on Matplotlib go to the article:
How to Solve Python ModuleNotFoundError: no module named ‘matplotlib’
Go to the online courses page on Python to learn more about Python for data science and machine learning.
Have fun and happy researching!

Suf is a senior advisor in data science with deep expertise in Natural Language Processing, Complex Networks, and Anomaly Detection. Formerly a postdoctoral research fellow, he applied advanced physics techniques to tackle real-world, data-heavy industry challenges. Before that, he was a particle physicist at the ATLAS Experiment of the Large Hadron Collider. Now, he’s focused on bringing more fun and curiosity to the world of science and research online.