Table of Contents
The F-test is commonly used in statistics to compare variances across multiple groups. Calculating the p-value from an F-score allows us to assess whether observed variances significantly differ between groups under the null hypothesis. In this guide, we’ll explore how to calculate the p-value from an F-score in R with practical examples.
Introduction to F-Scores and P-Values
The F-score, used in an F-test, is calculated to determine the ratio of variances between two groups. It is calculated as follows:
\[ F = \frac{\text{variance between groups}}{\text{variance within groups}} \]
where a high F-value suggests a significant difference in variances between groups. Once we have the F-score, we can calculate the p-value to determine the probability of obtaining a value as extreme as the observed F-score under the null hypothesis.
Understanding the F-Score
An F-score measures the ratio of variances between groups. Higher F-scores indicate greater variance between groups relative to variance within groups. This is commonly used in ANOVA testing and other statistical comparisons involving multiple groups.
Calculating the P-Value from an F-Score
To calculate the p-value from an F-score, we use the F-distribution. The calculation depends on the degrees of freedom for both the numerator (between groups) and denominator (within groups).
Formula for Calculating the P-Value
For a given F-score with degrees of freedom \( df_1 \) and \( df_2 \), the p-value is calculated as follows:
- One-Tailed Test: The p-value is given by: \[ p = P(F > f) = pf(f, df_1, df_2, lower.tail = FALSE) \]
- Two-Tailed Test: The two-tailed p-value considers extreme values on both sides of the distribution: \[ p = 2 \times pf(|f|, df_1, df_2, lower.tail = FALSE) \]
In R, we can calculate these directly using the pf function:
# One-tailed p-value
p_value_one_tailed <- pf(f_score, df1, df2, lower.tail = FALSE)

# Two-tailed p-value
p_value_two_tailed <- 2 * pf(abs(f_score), df1, df2, lower.tail = FALSE)
Example: Calculating P-Value from an F-Score
Suppose we have an F-score of 2.5 with 3 and 15 degrees of freedom. We’ll calculate the one-tailed and two-tailed p-values:
# F-score and degrees of freedom
f_score <- 2.5
df1 <- 3
df2 <- 15

# Calculate one-tailed p-value
p_value_one_tailed <- pf(f_score, df1, df2, lower.tail = FALSE)

# Calculate two-tailed p-value
p_value_two_tailed <- 2 * pf(abs(f_score), df1, df2, lower.tail = FALSE)

p_value_one_tailed
p_value_two_tailed
The output is:
# One-tailed p-value
[1] 0.0991

# Two-tailed p-value
[1] 0.1982
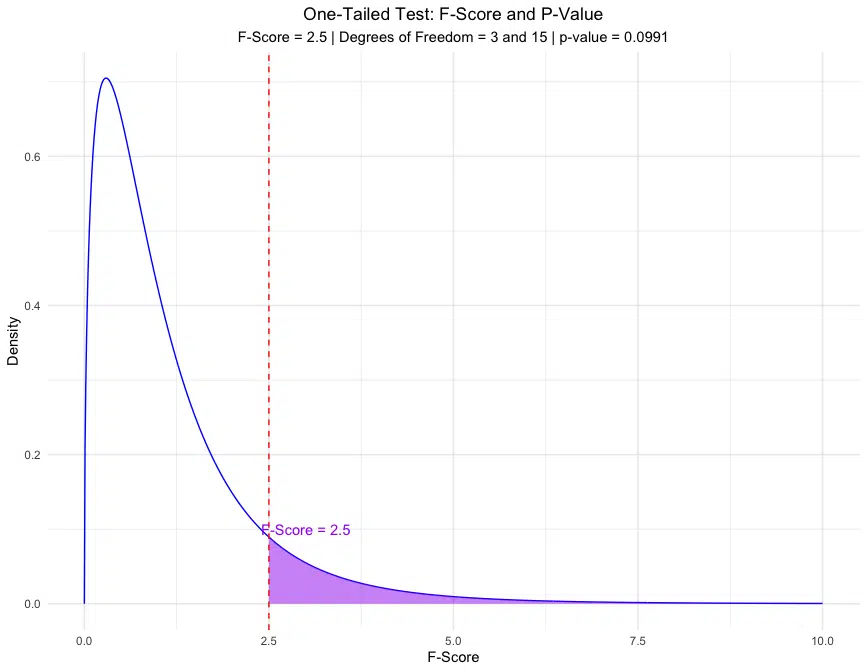
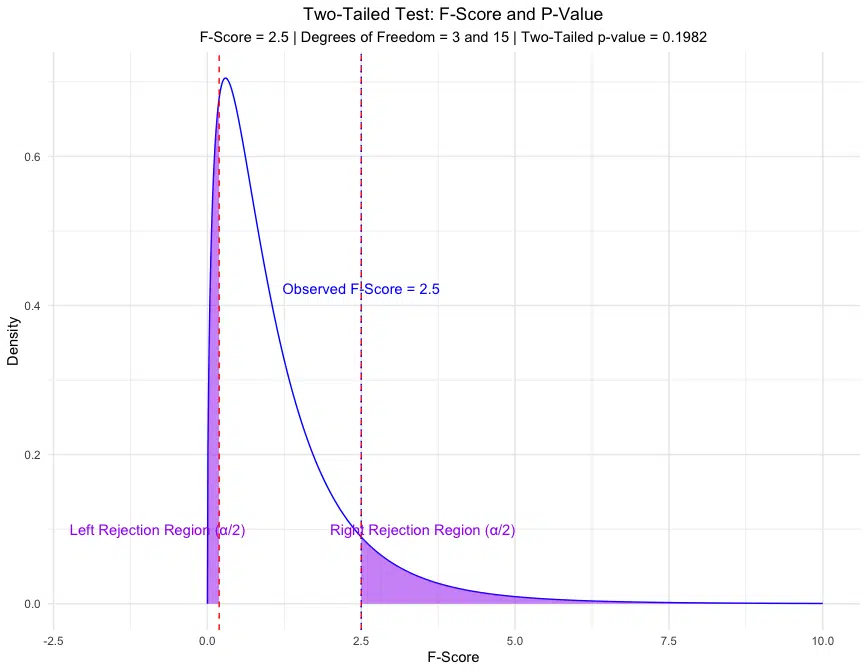
The one-tailed p-value of 0.0991 suggests a 9.91% chance of observing an F-score as extreme as 2.5 or more if the null hypothesis is true. The two-tailed p-value of 0.1982 indicates a 19.82% chance of observing an F-score as extreme in either direction, under the null hypothesis.
Visualization of the F-Score and P-Value
Visualizing the F-score on an F-distribution allows us to see the area representing the p-value for both one-tailed and two-tailed tests.
Example: Plotting the One-Tailed and Two-Tailed P-Values
# Load ggplot2 for plotting
library(ggplot2)

# Set parameters
f_score <- 2.5
df1 <- 3
df2 <- 15

# Calculate p-values
p_value_one_tailed <- pf(f_score, df1, df2, lower.tail = FALSE)
p_value_two_tailed <- 2 * p_value_one_tailed

# Calculate critical values for two-tailed test
alpha <- p_value_two_tailed / 2
critical_value_right <- qf(1 - alpha, df1, df2)
critical_value_left <- qf(alpha, df1, df2)

# Generate data for F-distribution
x <- seq(0, 10, length = 1000)
y <- df(x, df1, df2)
df_plot <- data.frame(x = x, y = y)

# One-Tailed Plot
one_tailed_plot <- ggplot(df_plot, aes(x, y)) +
    geom_line(color = "blue") +
    geom_area(data = subset(df_plot, x >= f_score), aes(x, y), fill = "purple", alpha = 0.5) +
    labs(
        title = "One-Tailed Test: F-Score and P-Value",
        subtitle = paste("F-Score =", round(f_score, 2),
                         "| Degrees of Freedom =", df1, "and", df2,
                         "| p-value =", round(p_value_one_tailed, 4)),
        x = "F-Score",
        y = "Density"
    ) +
    geom_vline(xintercept = f_score, color = "red", linetype = "dashed") +
    annotate("text", x = f_score + 0.5, y = 0.1, label = paste("F-Score =", round(f_score, 2)), color = "purple") +
    theme_minimal() +
    theme(plot.title = element_text(hjust = 0.5), plot.subtitle = element_text(hjust = 0.5))

# Two-Tailed Plot
two_tailed_plot <- ggplot(df_plot, aes(x, y)) +
    geom_line(color = "blue") +
    scale_x_continuous(limits = c(-2, 10)) +
    geom_area(data = subset(df_plot, x >= critical_value_right), aes(x, y), fill = "purple", alpha = 0.5) +
    geom_area(data = subset(df_plot, x <= critical_value_left), aes(x, y), fill = "purple", alpha = 0.5) +
    labs(
        title = "Two-Tailed Test: F-Score and P-Value",
        subtitle = paste("F-Score =", round(f_score, 2),
                         "| Degrees of Freedom =", df1, "and", df2,
                         "| Two-Tailed p-value =", round(p_value_two_tailed, 4)),
        x = "F-Score",
        y = "Density"
    ) +
    geom_vline(xintercept = c(critical_value_right, critical_value_left), color = "red", linetype = "dashed") +
    geom_vline(xintercept = f_score, color = "blue", linetype = "dotted") +
    annotate("text", x = critical_value_right + 1, y = 0.1, label = "Right Rejection Region (α/2)", color = "purple") +
    annotate("text", x = critical_value_left - 1, y = 0.1, label = "Left Rejection Region (α/2)", color = "purple") +
    annotate("text", x = f_score, y = max(y) * 0.6, label = paste("Observed F-Score =", round(f_score, 2)), color = "blue") +
    theme_minimal() +
    theme(plot.title = element_text(hjust = 0.5), plot.subtitle = element_text(hjust = 0.5))

# Print both plots
print(one_tailed_plot)
print(two_tailed_plot)


The plots above show the areas in the distribution representing the p-value for both one-tailed and two-tailed tests, with the calculated p-values displayed.
Assumptions and Limitations of Using F-Scores and P-Values
Calculating a p-value from an F-score involves several assumptions and limitations. Here’s what to consider:
Assumptions
- Normality of Data: The F-test assumes that the data in each group follows a normal distribution. This assumption is particularly crucial for small sample sizes.
- Independence of Observations: Observations should be independent across and within groups.
- Equality of Variances: The F-test assumes equal variances within each group. If variances are not equal, the test may yield inaccurate results.
Limitations
- Sensitivity to Non-Normality: The F-test is sensitive to deviations from normality, especially with small sample sizes.
- Interpretation of P-Values: A significant p-value suggests an unlikely result under the null hypothesis but does not measure effect size or practical significance.
- Only Measures Variance Ratio: The F-test is solely for comparing variances and does not consider means or other characteristics.
By understanding these assumptions and limitations, you can better interpret F-scores and p-values in statistical analyses.
Conclusion
Calculating the p-value from an F-score in R is straightforward using the `pf` function, making it a convenient tool for statisticians and researchers conducting hypothesis testing on variance differences across groups. This process not only quantifies the likelihood of observing an F-score as extreme as the one calculated but also strengthens our ability to discern if group variances are statistically significant under the null hypothesis. By understanding and applying these techniques, statisticians can better evaluate assumptions of homogeneity of variances, which is essential in ANOVA, regression, and other comparative analyses. Accurate p-value calculations allow for robust decision-making and enable more nuanced interpretations of data variance, laying a foundation for valid conclusions in scientific research and applied statistics.
Try the F-Score to P-Value Calculator
To calculate the p-value from an F-score for your data, check out our F-Score to P-Value Calculator on the Research Scientist Pod.
Have fun and happy researching!
Suf is a senior advisor in data science with deep expertise in Natural Language Processing, Complex Networks, and Anomaly Detection. Formerly a postdoctoral research fellow, he applied advanced physics techniques to tackle real-world, data-heavy industry challenges. Before that, he was a particle physicist at the ATLAS Experiment of the Large Hadron Collider. Now, he’s focused on bringing more fun and curiosity to the world of science and research online.

