This tutorial will go through how to calculate the cosine similarity in R for vectors and matrices with code examples.
Table of contents
What is Cosine Similarity?
Cosine similarity measures the similarity between two vectors of a multi-dimensional space. It is the cosine of the angle between two vectors determining whether they are pointing in the same direction.
The smaller the angle between two vectors, the more similar they are to each other. The similarity measure ignores the differences in magnitude or scale between the vectors.
Both vectors must be part of the same inner product space, meaning their inner product multiplication must produce a scalar value. Cosine similarity is used widely throughout data science and machine learning.
Real-world use cases of cosine similarity include recommender systems, measuring document similarity in natural language processing and the cosine-similarity locality-sensitive hashing technique for fast DNA sequence matching.
How to Calculate Cosine Similarity
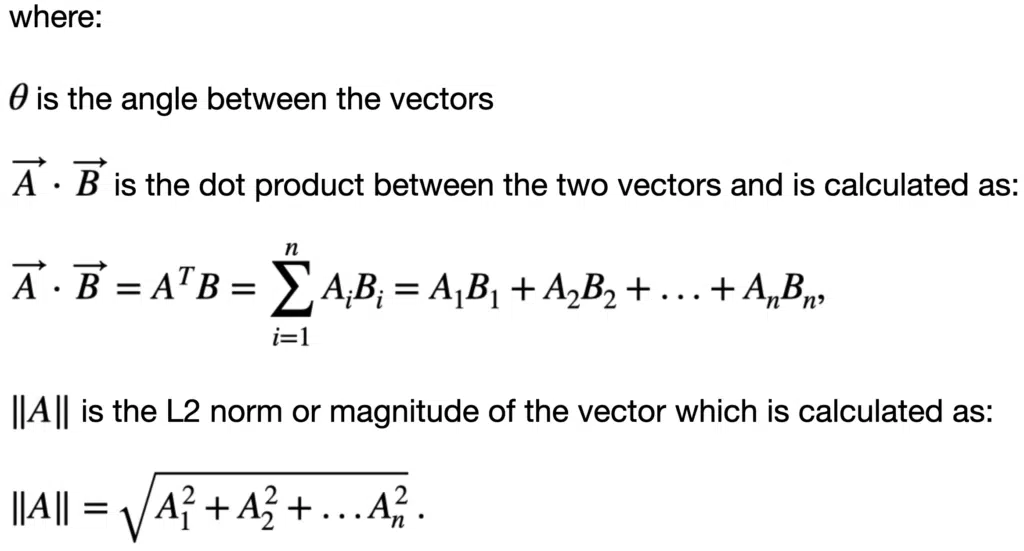
Consider two vectors, A and B. We can calculate the cosine similarity between the vectors as follows:


The cosine similarity divides the vector dot product vectors by the Euclidean norm product or vector magnitudes. The similarity can be any value between -1 and +1.
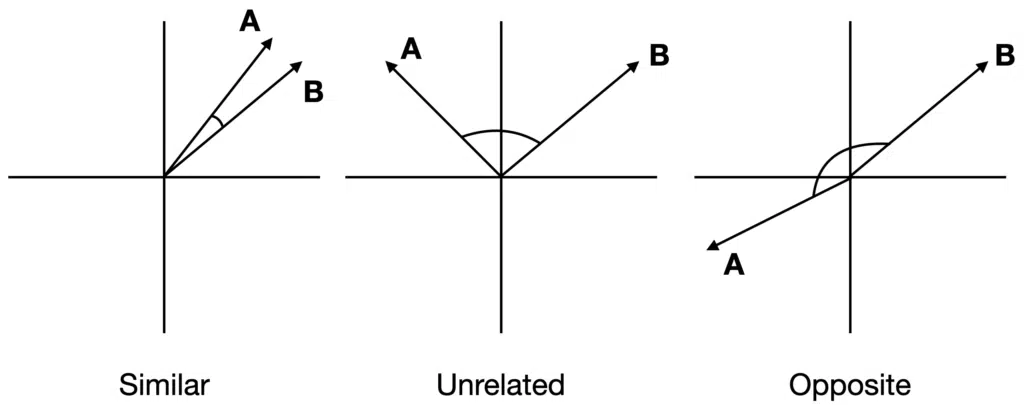
Visual Description of Cosine Similarity
Suppose the angle between two vectors is less than 90 degrees and closer to zero; the cosine similarity measurement will be close to 1. Therefore A and B are more similar to each other. If the angle between the two vectors is 90 degrees, the cosine similarity will have a value of 0; this means that the two vectors are orthogonal and have no correlation between them. The cos($latex \theta$) value can be in the range [-1, 1]. If the angle is much greater than 90 degrees and close to 180 degrees, the similarity value will be close to -1, indicating strongly opposite vectors or no similarity between them.

Cosine Similarity Between Two Vectors in R
Let’s look at the code to calculate the cosine similarity between two vectors in R:
install.packages("lsa")
library(lsa)

x <- c(0.12, 0.44, 0.5, 0.3, 0.7, 0.04, 0.9, 0.8)
y <- c(0.24, 0.5, 0.7, 0.21, 0.69, 0.2, 0.7, 0.5)

cosine(x, y)
          [,1]
[1,] 0.9551402
The cosine similarity between the two vectors is 0.9551402.
Cosine Similarity of a Matrix in R
We can also calculate the cosine similarity between a matrix of vectors:
x <- c(10, 13, 14, 20, 21, 40, 50, 27)
y <- c(7, 10, 12, 19, 24, 36, 40, 20)
z <- c(8, 15, 25, 3, 1, 7, 0, 50)

mat <- cbind(x, y, z)

cosine(mat)
          x         y         z
x 1.0000000 0.9928947 0.5060730
y 0.9928947 1.0000000 0.4638441
z 0.5060730 0.4638441 1.0000000
We can interpret the output as follows:
- The cosine similarity between vectors
xandyis 0.9928947 - The cosine similarity between vectors
xandzis 0.5060730 - The cosine similarity between vectors
yandzis 0.4638441
Convert Data Frame to Matrix
The cosine() function works on a matrix of vectors and pairs of vectors but does not work on a data frame. We can verify this by creating a data frame containing three vectors and passing it to the cosine function
data <- data.frame(x,y,z)
data
  x  y  z
1 10  7  8
2 13 10 15
3 14 12 25
4 20 19  3
5 21 24  1
6 40 36  7
7 50 40  0
8 27 20 50
cosine(data)
Error in cosine(data) :
  argument mismatch. Either one matrix or two vectors needed as input.
Passing a data frame to the cosine function raises an argument mismatch error. We can convert a data frame to a matrix using the as.matrix() function. Let’s look at the revised code:
cosine(as.matrix(data))
         x         y         z
x 1.0000000 0.9928947 0.5060730
y 0.9928947 1.0000000 0.4638441
z 0.5060730 0.4638441 1.0000000
We successfully converted the data frame to a matrix and passed it to the cosine function.
Summary
Congratulations on reading to the end of this tutorial!
If you want to learn how to calculate cosine similarity in Python, visit our guide: How to Calculate Cosine Similarity in Python
If you want to learn how to calculate cosine similarity in C++, visit our gude: How to Calculate Cosine Similarity in C++
Go to the online courses page on R to learn more about coding in R for data science and machine learning.
Have fun and happy researching!
Suf is a senior advisor in data science with deep expertise in Natural Language Processing, Complex Networks, and Anomaly Detection. Formerly a postdoctoral research fellow, he applied advanced physics techniques to tackle real-world, data-heavy industry challenges. Before that, he was a particle physicist at the ATLAS Experiment of the Large Hadron Collider. Now, he’s focused on bringing more fun and curiosity to the world of science and research online.

