You can remove a legend from a plot using the syntax legend.position="none" for the plot theme. For example,
library(ggplot2)
ggplot(data = mtcars, aes(x = mpg, y = disp, color = vs)) +
geom_point() +
theme(legend.position="none")
This tutorial will go through how to remove a legend with a full code example.
Table of contents
Example
Examine mtcars dataset
First, let’s look at the mtcars dataset using the head() function:
head(mtcars)
                   mpg cyl disp  hp drat    wt  qsec vs am gear carb
Mazda RX4         21.0   6  160 110 3.90 2.620 16.46  0  1    4    4
Mazda RX4 Wag     21.0   6  160 110 3.90 2.875 17.02  0  1    4    4
Datsun 710        22.8   4  108  93 3.85 2.320 18.61  1  1    4    1
Hornet 4 Drive    21.4   6  258 110 3.08 3.215 19.44  1  0    3    1
Hornet Sportabout 18.7   8  360 175 3.15 3.440 17.02  0  0    3    2
Valiant           18.1   6  225 105 2.76 3.460 20.22  1  0    3    1
The head() function returns the first six rows of the dataset. The mtcars data comprises fuel consumption and ten aspects of automobile design and performance for thirty-two cars.
We want to plot displacement (disp) against miles/US gallon (mpg) against and use the engine type (vs) as a third dimension (color)
Plot using ggplot2 with legend
Let’s look at how to plot the specified aspects using ggplot2 with the legend included:
# Import ggplot2

library(ggplot2)

# Create ggplot2 object

ggplot(data = mtcars, aes(x = mpg, y = disp, color = vs)) +

geom_point()
Let’s run the code to get the plot
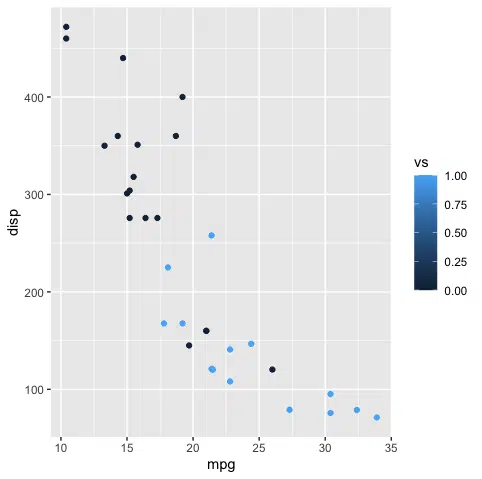
We can see on the right the legend shows the color gradient for the vs aspect.
Plot using ggplot2 with legend removed
If we want to remove the legend from the plot, we can use theme() to edit the plot theme. The property, legend.position specifies the position of legends. If we set this property to none, we will remove the legend. Let’s look at the updated code:
library(ggplot2)
ggplot(data = mtcars, aes(x = mpg, y = disp, color = vs)) +
geom_point()+
theme(legend.position="none")
Let’s run the code to get the plot:
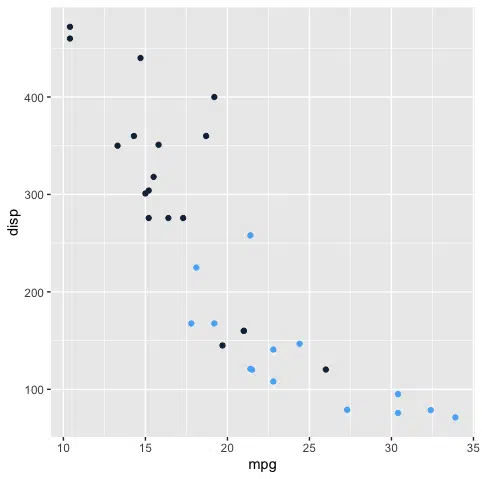
We can see the plot no longer has a legend.
Summary
Congratulations on reading to the end of this tutorial!
For further reading on R, go to the articles:
- How to Transpose a Data Frame in R
- How to Apply a Function to Every Row of a Table in R using dplyr
- How to Add an Index column to a Data Frame in R
Go to the online courses page on R to learn more about coding in R for data science and machine learning.
Have fun and happy researching!

Suf is a senior advisor in data science with deep expertise in Natural Language Processing, Complex Networks, and Anomaly Detection. Formerly a postdoctoral research fellow, he applied advanced physics techniques to tackle real-world, data-heavy industry challenges. Before that, he was a particle physicist at the ATLAS Experiment of the Large Hadron Collider. Now, he’s focused on bringing more fun and curiosity to the world of science and research online.