You can only plot numeric data when using Pandas. If you try to plot with non-numeric data, the Python interpreter will raise the TypeError: no numeric data to plot. This error typically occurs when you have strings representing numbers in your DataFrame. To solve this error you can use the DataFrame.astype() method, for example,
df['column_name'] = df['column_name'].astype(float)
Or you can use the pandas.to_numeric() method, for example,
df['column_name'] = pd.to_numeric(df['column_name'])
This tutorial will go through the error in detail and how to solve it with code examples.
Table of contents
TypeError: empty ‘dataframe’ no numeric data to plot
TypeErrror occurs when we attempt to perform an illegal operation for a particular data type. In this case, the illegal operation is plotting and the data type is non-numeric. We typically encounter this error when one or more column in a DataFrame has numeric strings instead of numbers.
Example
Let’s look at an example of a DataFrame with two columns containing the heights and weights of eight subjects. We want to plot Height and Weight using the DataFrame.plot function.
import pandas as pd
import matplotlib.pyplot as plt

df = pd.DataFrame({'Height': ['170', '180', '155', '160', '175', '177', '190', '140'],
'Weight':['60', '88.5', '55', '65', '80', '95', '78.4', '45']})

print(df)

df[['Height', 'Weight']].plot()

plt.show()
Let’s run the code to see what happens:
  Height Weight
0    170     60
1    180   88.5
2    155     55
3    160     65
4    175     80
5    177     95
6    190   78.4
7    140     45

File ~/opt/anaconda3/lib/python3.8/site-packages/pandas/plotting/_matplotlib/core.py:506, in MPLPlot._compute_plot_data(self)
    504 # no non-numeric frames or series allowed
    505 if is_empty:
--> 506     raise TypeError("no numeric data to plot")
    508 self.data = numeric_data.apply(self._convert_to_ndarray)

TypeError: no numeric data to plot
We raise the error because Height and Weight do not contain numeric values. We can verify this by using the types function, which will show the data type of each column:
print(df.dtypes)
Height    object
Weight    object
dtype: object
The Pandas dtype object is equivalent to string or mixed Python types.
Solution #1: Use DataFrame.astype()
We can use the astype() function to convert the columns to float. Let’s look at the revised code
import pandas as pd
import matplotlib.pyplot as plt

df = pd.DataFrame({'Height': ['170', '180', '155', '160', '175', '177', '190', '140'],
'Weight':['60', '88.5', '55', '65', '80', '95', '78.4', '45']})

# Convert DataFrame columns to Float
df['Height'] = df['Height'].astype(float)

df['Weight'] = df['Weight'].astype(float)

print(df.dtypes)

# Plot columns
df[['Height', 'Weight']].plot()

plt.show()
In the above code, we also print the dtype of the columns. Let’s run the code to see the result:
Height    float64
Weight    float64
dtype: object

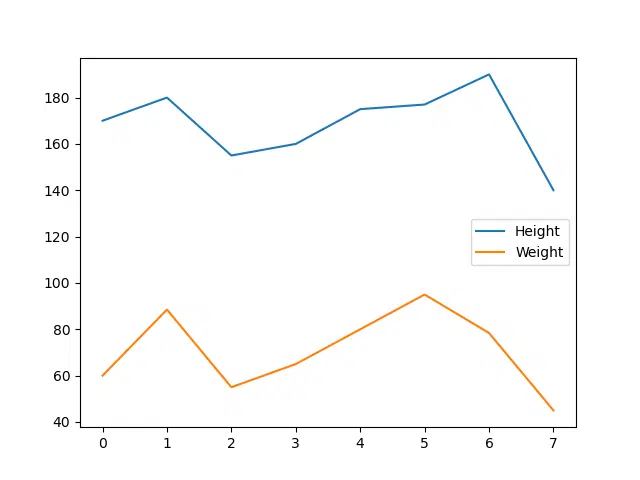
We successfully plotted the data in the two columns.
Solution #2: Use pandas.to_numeric()
We can also use the pandas.to_numeric function to convert the columns to numeric type. The default return dtype of the function is float64 or int64 depending on the data supplied.
import pandas as pd
import matplotlib.pyplot as plt

df = pd.DataFrame({'Height': ['170', '180', '155', '160', '175', '177', '190', '140'],
'Weight':['60', '88.5', '55', '65', '80', '95', '78.4', '45']})


# Convert Height column to int64 and Weight to float64
df['Height'] = pd.to_numeric(df['Height'])

df['Weight'] = pd.to_numeric(df['Weight'])

print(df.dtypes)


# Plot columns
df[['Height', 'Weight']].plot()

plt.show()
In the above code, we also print the dtype of the columns. Let’s run the code to see the result:
Height      int64
Weight    float64
dtype: object

We successfully plotted the data in the two columns.
Summary
Congratulations on reading to the end of this tutorial! The TypeError: empty ‘dataframe’ no numeric data to plot occurs when you try to plot values from a DataFrame that are not numeric values. You can resolve this error by converting the data to numeric values using either
DataFrame.astype()functionpandas.to_numeric()function
For further reading on Pandas, go to the article: Introduction to Pandas: A Complete Tutorial for Beginners
Have fun and happy researching!
Suf is a senior advisor in data science with deep expertise in Natural Language Processing, Complex Networks, and Anomaly Detection. Formerly a postdoctoral research fellow, he applied advanced physics techniques to tackle real-world, data-heavy industry challenges. Before that, he was a particle physicist at the ATLAS Experiment of the Large Hadron Collider. Now, he’s focused on bringing more fun and curiosity to the world of science and research online.

