In Python, a Pandas Series is a one-dimensional labelled array capable of holding data of any type. Pandas Series is the same as a column in an Excel spreadsheet.
You cannot reshape a Pandas Series using pandas.Series.reshape. This method has been deprecated since pandas version 0.19.0. if you try to call reshape on a Series object, you will raise the AttributeError: ‘Series’ object has no attribute ‘reshape’.
To solve this error, you can get the underlying ndarray from the Series by calling values, then call reshape on the ndarray. For example,
X.values.reshape(-1, 1)
This tutorial will go through the error in detail and how to solve it with code examples.
Table of contents
AttributeError: ‘Series’ object has no attribute ‘reshape’
AttributeError occurs in a Python program when we try to access an attribute (method or property) that does not exist for a particular object. The part “‘Series’ object has no attribute ‘reshape’” tells us that the Series object we are handling does not have the reshape attribute. The reshape() method belongs to the numpy.ndarray class and returns a new array containing the same data as the original array with a new shape.
ndarray.reshape Syntax
As of pandas version 0.19.0 Series.reshape() is deprecated. If we want to use the reshape method on the values in the Series object, we need to use .values.reshape(...) instead.
The syntax for ndarray.reshape() is as follows:
ndarray.reshape(shape, order='C')
Parameters
shape: Required. The new shape can be an int or tuple of ints, and the new shape should be compatible with the original shape. If the shape is an integer, the result will be a 1-D array of that length.order: Optional. Read the array elements in the specified order and place elements into the reshaped array using this index order. ‘C’ = C-like order, ‘F’ = Fortran-like index order, ‘A’ means to read/write in Fortran-like index order if the array is Fortran contiguous in memory, otherwise C-like order.
Returns
- Reshaped ndarray.
Example: Linear Regression with Scikit-Learn
Let’s look at an example where we want to perform linear regression on a dataset. Our dataset will contain the weekly counts of kilograms of vegetables harvested on a farm. The data is in csv format, where the first column is the week as a number and the second column is the number of vegetables harvested in kilograms. Let’s look at the contents of the file:
week,vegcount
1,12
2,45
3,130
4,287
5,397
6,200
7,240
8,450
9,600
10,800
11,750
12,700
13,230
14,750
15,800
16,810
17,933
18,799
19,950
20,1001
21,1500
22,1300
23,1900
24,2800
25,1200
26,1400
27,1800
28,2000
29,2400
30,3100
We will save this file as veg.csv. Next, we will look at the code to load the data into the program, split the data into training, and test datasets then fit a linear model on the training dataset. We will use Scikit-Learn to split the data and perform linear regression.
import pandas as pd
from sklearn.model_selection import train_test_split
from sklearn.linear_model import LinearRegression

df = pd.read_csv('veg.csv')

X_train, X_test, y_train, y_test = train_test_split(df['week'], df['vegcount'], random_state=0)

regr = LinearRegression()

regr.fit(X_train, y_train)
Let’s run the code to see what happens:
ValueError: Expected 2D array, got 1D array instead:
array=[18 23  6 17  9 15 24 21  2 30  7  5 19 20 10  8 26  4  1 22 16 13].
Reshape your data either using array.reshape(-1, 1) if your data has a single feature or array.reshape(1, -1) if it contains a single sample.
We get the error because the fit() method expects a two-dimensional array instead of a one-dimensional array. We can reshape the array to a 2D array of shape [n_samples, n_features]. If n_features = 1 then there is only one column or feature, if n_samples=-1 the number of rows is extracted automatically for this single feature. Let’s look at the revised code:
import pandas as pd
from sklearn.model_selection import train_test_split
from sklearn.linear_model import LinearRegression

df = pd.read_csv('veg.csv')

X_train, X_test, y_train, y_test = train_test_split(df['week'], df['vegcount'], random_state=0)

regr = LinearRegression()

X_train = X_train.reshape(-1, 1)

regr.fit(X_train, y_train)
Let’s run the code to see what happens:
---------------------------------------------------------------------------
AttributeError                            Traceback (most recent call last)
<ipython-input-3-00a316413935> in <module>
      9 regr = LinearRegression()
     10
---> 11 X_train = X_train.reshape(-1, 1)
     12
     13 regr.fit(X_train, y_train)

~/opt/anaconda3/lib/python3.8/site-packages/pandas/core/generic.py in __getattr__(self, name)
   5581         ):
   5582             return self[name]
-> 5583         return object.__getattribute__(self, name)
   5584
   5585     def __setattr__(self, name: str, value) -> None:

AttributeError: 'Series' object has no attribute 'reshape'
We get a second error because we are trying to call the reshape method on a Series object instead of the underlying ndarray.
Solution
There are several ways to solve this error. First, we can call values on the Series objects to get the underlying ndarrays, then call reshape() on these arrays. Let’s look at the revised code:
import pandas as pd
from sklearn.model_selection import train_test_split
from sklearn.linear_model import LinearRegression
import matplotlib.pyplot as plt

df = pd.read_csv('veg.csv')

X_train, X_test, y_train, y_test = train_test_split(df['week'], df['vegcount'], random_state=0)

regr = LinearRegression()

X_train = X_train.values.reshape(-1, 1)

X_test = X_test.values.reshape(-1, 1)

regr.fit(X_train, y_train)
We can also convert the Series objects to ndarrays using numpy.array(). We have to import NumPy to do this. Let’s look at the revised code:
import pandas as pd
from sklearn.model_selection import train_test_split
from sklearn.linear_model import LinearRegression
import matplotlib.pyplot as plt
import numpy as np

df = pd.read_csv('veg.csv')

X_train, X_test, y_train, y_test = train_test_split(df['week'], df['vegcount'], random_state=0)

regr = LinearRegression()

X_train = np.array(X_train).reshape(-1, 1)

X_test = np.array(X_test).reshape(-1, 1)

regr.fit(X_train, y_train)
Thirdly we can convert the Series object to a DataFrame. When we pass the DataFrame to the train_test_split() function, it will return X_train and X_test as DataFrames. Let’s look at the revised code.
import pandas as pd
from sklearn.model_selection import train_test_split
from sklearn.linear_model import LinearRegression
import matplotlib.pyplot as plt

df = pd.read_csv('veg.csv')

X_train, X_test, y_train, y_test = train_test_split(df[['week']],
df['vegcount'], random_state=0)

print(type(df[['week']]))

regr = LinearRegression()

regr.fit(X_train, y_train)
Using any of the three approaches, we can evaluate the linear regression model on the training and test data by calling the score() method of the Linear_Regression object.
train_score = regr.score(X_train, y_train)

print("The training score of the model is: ", train_score)

test_score = regr.score(X_test, y_test)

print("The score of the model on test data is:", test_score )
Let’s run the code to see the result:
The training score of the model is:  0.7519355097413883
The score of the model on test data is: 0.8660016437650956
The Linear regression model achieved a score of 0.866 on the test dataset and 0.75 on the training dataset.
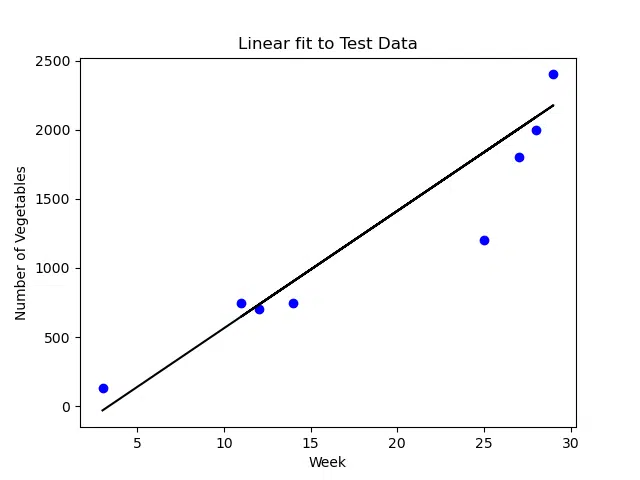
Next, we will visualize the result of the linear regression model by plotting the regression line with the test data. We will need to import matplotlib for the plotting functionalities.
import matplotlib.pyplot as plt

y_pred = regr.predict(X_test)

plt.scatter(X_test, y_test, color='b')

plt.xlabel('Week')

plt.ylabel('Number of Vegetables')

plt.title('Linear fit to Test Data')

plt.plot(X_test, y_pred, color='k')

plt.show()
Let’s run the code to see the final output:
Summary
Congratulations on reading to the end of this tutorial! The AttributeError ‘Series’ object has no attribute ‘reshape’ occurs when you try to call the reshape() method on a Series object as if it were a ndarray. To solve this error, you can use values.reshape() to reshape the underlying ndarray in the Series object. Alternatively, you can convert the Series object to a ndarray using numpy.array() then call reshape().
For further reading on pandas Series, go to the article: How to Solve Python AttributeError: ‘Series’ object has no attribute ‘split’
To learn more about Python for data science and machine learning, go to the online courses page on Python for the most comprehensive courses available.
Have fun and happy researching!

Suf is a senior advisor in data science with deep expertise in Natural Language Processing, Complex Networks, and Anomaly Detection. Formerly a postdoctoral research fellow, he applied advanced physics techniques to tackle real-world, data-heavy industry challenges. Before that, he was a particle physicist at the ATLAS Experiment of the Large Hadron Collider. Now, he’s focused on bringing more fun and curiosity to the world of science and research online.