If you are using the ggplot2 package to visualize data and forget to use a plus sign in the code, you will encounter the error: cannot add ggproto plots together.
This tutorial will go through how to solve the error with code examples.
Example
Let’s look at an example of a data frame that contains the number of ice creams sold over ten days together with the temperature on each day in celsius.
df <- data.frame(day=c(1, 2, 3, 4, 5, 6, 7, 8, 9, 10),
temperature=c(10, 18, 22, 19, 28, 15, 20, 17, 13, 30),
ice_cream_sold=c(5, 10, 40, 38, 100, 40, 120, 10, 30, 150))

df
 day temperature ice_cream_sold
1    1          10              5
2    2          18             10
3    3          22             40
4    4          19             38
5    5          28            100
6    6          15             40
7    7          20            120
8    8          17             10
9    9          13             30
10  10          30            150
Let’s try to plot temperature and ice_cream_sold as two line plots on the same figure using ggplot2.
library(ggplot2)

ggplot(df, aes(x = day))
  geom_line(aes(y = temperature, color = 'temperature')) +
  geom_line(aes(y = ice_cream_sold, color = 'ice_cream_sold'))
Let’s run the code to see what happens:
Error in `+.gg`:
! Cannot add ggproto objects together. Did you forget to add this object to a ggplot object?
The error occurs because we are missing a + sign at the end of the first line.
Solution
We can solve this error by ensuring the plus signs are in place to create a ggplot chain. We need a + between the first ggplot() call and geom_point. Let’s look at the revised code:
library(ggplot2)

coeff <- 1

ggplot(df, aes(x = day)) +
  geom_line(aes(y = ice_cream_sold, color = 'ice_cream_sold')) +
  geom_line(aes(y = temperature, color = 'temperature'))
Let’s run the code to get the result:
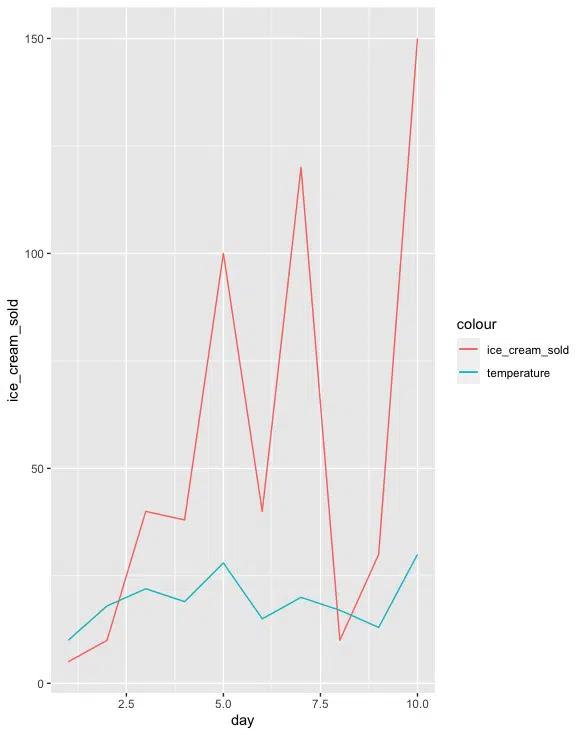
We successfully plotted the two variables ice_cream_sold and temperature on the same figure.
Summary
Congratulations on reading to the end of this tutorial!
For further reading on R related errors, go to the articles:
- How to Solve R Error: $ operator is invalid for atomic vectors
- How to Solve R Error in apply: dim(X) must have a positive length
- How to Solve R Error in Function: unused arguments
- How to Solve R Error: Unexpected else
Go to the online courses page on R to learn more about coding in R for data science and machine learning.
Have fun and happy researching!

Suf is a senior advisor in data science with deep expertise in Natural Language Processing, Complex Networks, and Anomaly Detection. Formerly a postdoctoral research fellow, he applied advanced physics techniques to tackle real-world, data-heavy industry challenges. Before that, he was a particle physicist at the ATLAS Experiment of the Large Hadron Collider. Now, he’s focused on bringing more fun and curiosity to the world of science and research online.