This error occurs when you try to create a scatter plot using data frames instead of a pair of vectors.
To solve this error, you can extract vectors from columns using a comma when subsetting the data frame or using the $ operator followed by the column names.
This tutorial will go through the error in detail and how to solve it with code examples.
Table of contents
Example
Let’s look at an example of a data frame containing random data.
set.seed(0)

df <- data.frame(x=rnorm(10),
y=runif(10))
              x          y
1   1.262954285 0.77744522
2  -0.326233361 0.93470523
3   1.329799263 0.21214252
4   1.272429321 0.65167377
5   0.414641434 0.12555510
6  -1.539950042 0.26722067
7  -0.928567035 0.38611409
8  -0.294720447 0.01339033
9  -0.005767173 0.38238796
10  2.404653389 0.86969085
Next, we will try to plot the two variables in the data frame as a scatter plot.
plot(df[1], df[2])
Let’s run the code to see what happens:
Error in stripchart.default(x1, ...) : invalid plotting method
The error occurs because df[1] and df[2] are data frames. The plot method is only suitable for vectors. We can verify that df[1] and df[2] are data frames using the class() function:
class(df[1])
class(df[2])
[1] "data.frame"
[1] "data.frame"
Solution #1: Use Comma with Subscript Operator
We can solve this error by specifying a comma when subsetting the data frame. To extract a single column from a data frame, we specify a comma and then the column position after the comma. Since the data frame has only two columns, we need column positions 1 and 2. Let’s look at the revised code:
plot(df[,1], df[,2])
Let’s run the code to see the result:
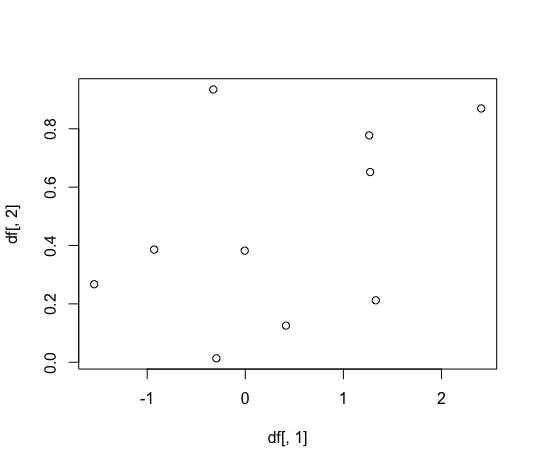
We successfully created the scatter plot.
We can verify that subsetting by the position of the columns returns vectors using is.vector(). If is.vector() returns TRUE for the object you pass to it, the object is a vector.
is.vector(df[,1])
is.vector(df[,2])
[1] TRUE
[1] TRUE
Solution #2: Use Comma with Dollar-Sign Subset Operator
We can also solve this error using the subset operator $. We need to place the dollar sign after the data frame and the column name after the dollar sign. Let’s look at the revised code:
plot(df$x, df$y)
Let’s run the code to see the result:

We successfully created the scatter plot.
We can verify that subsetting using the $ operator returns vectors using is.vector().
is.vector(df$x)
is.vector(df$y)
[1] TRUE
[1] TRUE
Summary
Congratulations on reading to the end of this tutorial!
For further reading on R related errors, go to the article:
- How to Count the Number of NA in R
- How to Solve R Error: non-conformable arguments
- How to Solve R Error: not defined because of singularities
Go to the online courses page on R to learn more about coding in R for data science and machine learning.
Have fun and happy researching!

Suf is a senior advisor in data science with deep expertise in Natural Language Processing, Complex Networks, and Anomaly Detection. Formerly a postdoctoral research fellow, he applied advanced physics techniques to tackle real-world, data-heavy industry challenges. Before that, he was a particle physicist at the ATLAS Experiment of the Large Hadron Collider. Now, he’s focused on bringing more fun and curiosity to the world of science and research online.