If you try to plot two variables and the variables do not have the same length, you will encounter the error: ‘x’ and ‘y’ lengths differ.
You can solve this error by ensuring the variables have the same length or by plotting only up to where the variables are the same length.
This tutorial will go through the error in detail and how to solve it with code examples.
Table of contents
Example
Consider an example where we want to create a scatterplot using two variables.
var1 = c(10, 12, 8, 8, 7)
var2 = c(30, 21, 50, 4, 9, 54, 12)

plot(var1, var2)
Let’s run the code to see what happens:
Error in xy.coords(x, y, xlabel, ylabel, log) :
  'x' and 'y' lengths differ
The error occurs because the variables var1 and var2 have differing lengths. We can verify this by using the comparison operator == and the built-in length() function.
length(var1) == length(var2)
If the expression evaluates to TRUE then the vectors are of equal length. Otherwise if the expression evaluates to FALSE, the vectors are not of equal length.
[1] FALSE
The vectors are not of equal length.
Solution #1
We can solve this error by ensuring the vectors are of equal length, either by removing values from the longer vector or adding values to the shorter vector, or both. Let’s look at the revised code:
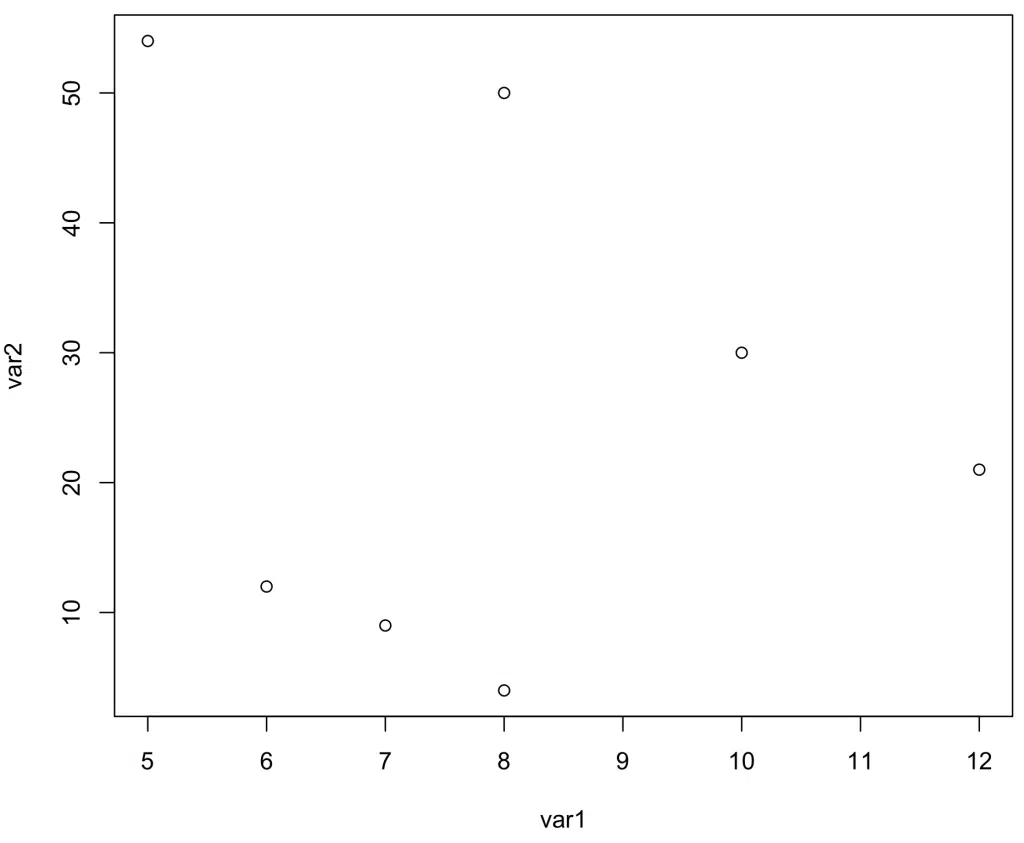
var1 = c(10, 12, 8, 8, 7, 5, 6)
var2 = c(30, 21, 50, 4, 9, 54, 12)

length(var1) == length(var2)

plot(var1, var2)
We will verify that the vectors are of equal length and plot the scatterplot.
[1] TRUE
Solution #2
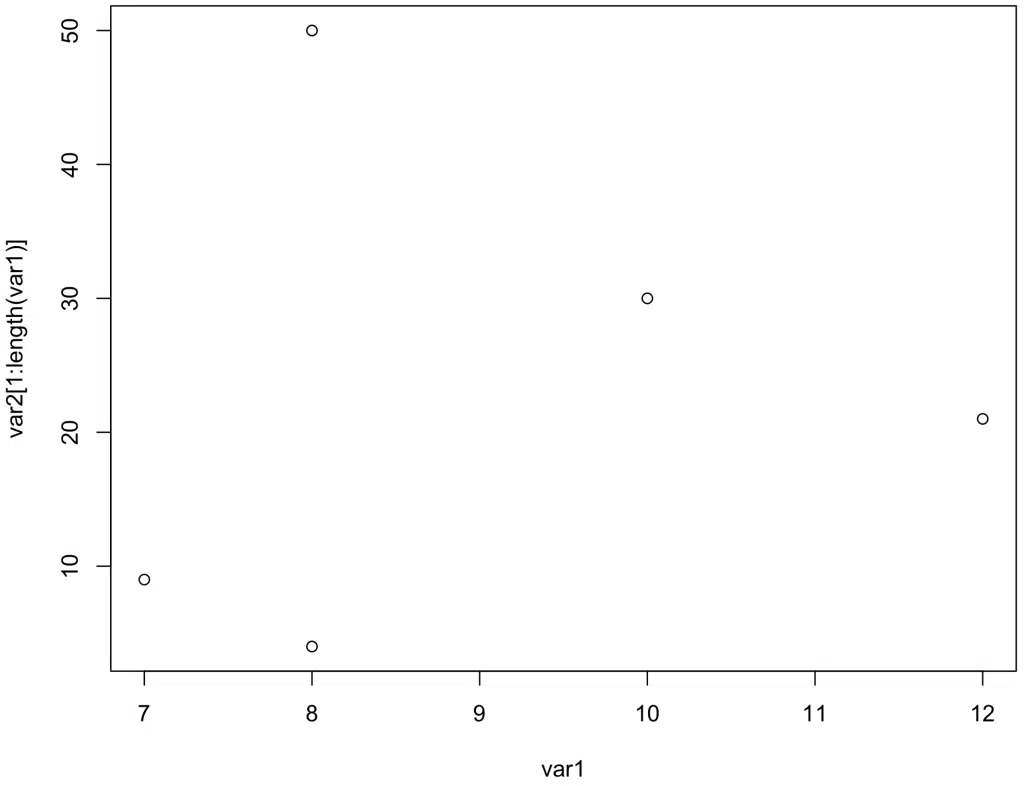
Alternatively, we can create a scatter plot with the values in both vectors only up to the length of the shorter vector. In this example the shorter vector, var1 has five values, whereas var2 has 7. Let’s look at the revised code where we plot the first 5 values of var1 and var2:
var1 = c(10, 12, 8, 8, 7)
var2 = c(30, 21, 50, 4, 9, 54, 12)
plot(var1, var2[1:length(var1)])
Summary
Congratulations on reading to the end of this tutorial!
For further reading on R related errors, go to the articles:
- How to Solve R Error: $ operator is invalid for atomic vectors
- How to Solve R Error in apply: dim(X) must have a positive length
- How to Solve R Error in Function: unused arguments
- How to Solve R Error: Unexpected else
Go to the online courses page on R to learn more about coding in R for data science and machine learning.
Have fun and happy researching!

Suf is a senior advisor in data science with deep expertise in Natural Language Processing, Complex Networks, and Anomaly Detection. Formerly a postdoctoral research fellow, he applied advanced physics techniques to tackle real-world, data-heavy industry challenges. Before that, he was a particle physicist at the ATLAS Experiment of the Large Hadron Collider. Now, he’s focused on bringing more fun and curiosity to the world of science and research online.