In R, the error: plot.window(…): need finite ‘ylim’ values occurs when you try to plot data that contains missing or non-numeric values on the y-axis. You will get a similar error: plot.window(…): need finite ‘xlim’ values if you have missing or non-numeric values on the x-axis. You can solve this error by ensuring there are only numeric values in your data.
This tutorial will go through the error in detail and how to solve it with code examples.
Example #1: error:plot.window(…): need finite ‘xlim’ values
Let’s try to create a scatterplot using two vectors.
x<- c(NA, NA, NA, NA, NA, NA)
y <- c(3, 6, 7, 8, 14, 19)

plot(x,y)
Error in plot.window(...) : need finite 'xlim' values
In addition: Warning messages:
1: In min(x) : no non-missing arguments to min; returning Inf
2: In max(x) : no non-missing arguments to max; returning -Inf
The error occurs because the vector we want to use for the x-values of the scatterplot contains all NA values.
Solution
We can solve this error by providing a vector of numbers instead of NA values. Let’s look at the revised code:
x<- c(0, 1, 2, 3, 4, 5)
y <- c(3, 6, 7, 8, 14, 19)

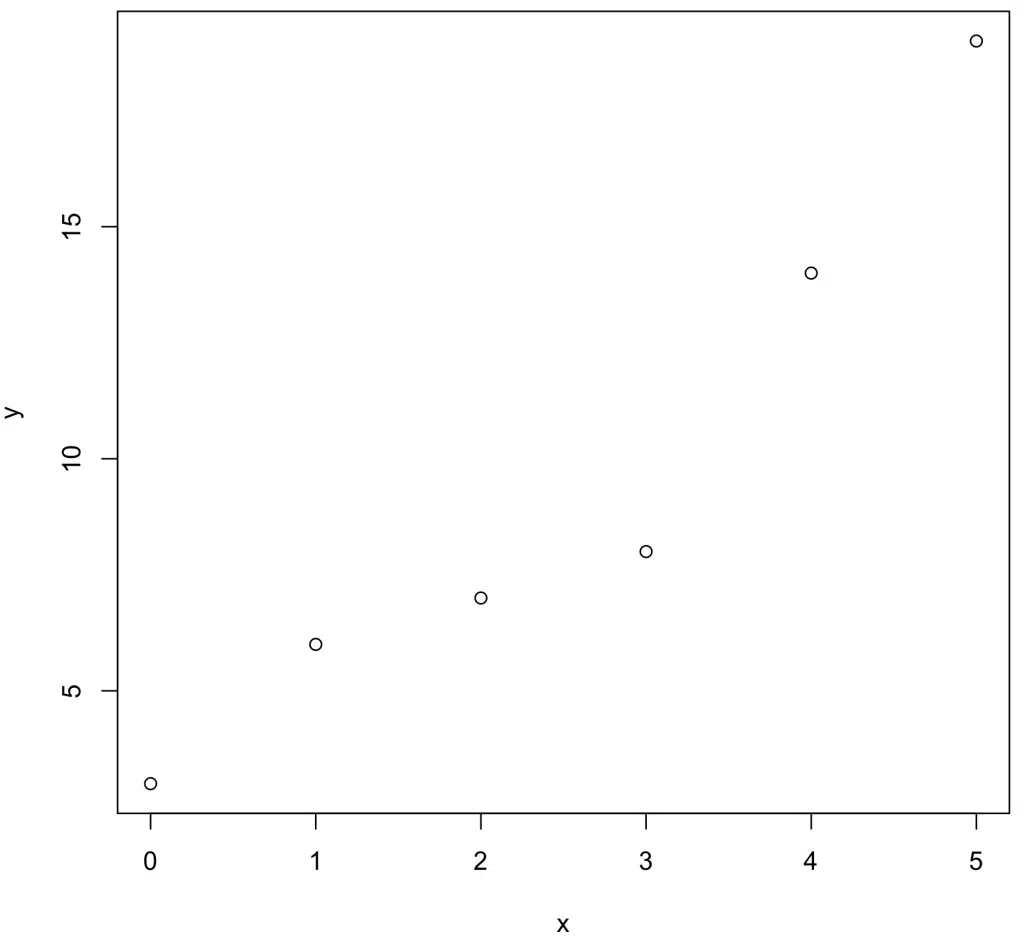
plot(x,y)

We successfully created the scatterplot by providing two numeric vectors.
Example #2: error:plot.window(…): need finite ‘ylim’ values
Let’s try to create a scatterplot using two vectors.
x<- c(0, 1, 2, 3, 4, 5)
y <- c(NA, NA, NA, NA, NA, NA)

plot(x,y)
Error in plot.window(...) : need finite 'ylim' values
In addition: Warning messages:
1: In min(x) : no non-missing arguments to min; returning Inf
2: In max(x) : no non-missing arguments to max; returning -Inf
The error occurs because the vector we want to use for the y-values of the scatterplot contains all NA values.
Solution
We can solve this error by providing a vector of numbers instead of NA values. Let’s look at the revised code:
x<- c(0, 1, 2, 3, 4, 5)
y <- c(3, 6, 7, 8, 14, 19)

plot(x,y)

We successfully created the scatterplot by providing two numeric vectors.
Example #3: error:plot.window(…): need finite ‘xlim’ values
Let’s try to create a scatterplot using two vectors.
x <- c('i', 'j', 'k', 'l', 'm', 'n')
x <- c(2, 'j', 'k', 0, 'm', 9)
y <- c(3, 'a', 7, 8, 14, 19)

y <- c(3, 6, 7, 8, 14, 19)
plot(x,y)
Error in plot.window(...) : need finite 'xlim' values
In addition: Warning messages:
1: In xy.coords(x, y, xlabel, ylabel, log) : NAs introduced by coercion
2: In min(x) : no non-missing arguments to min; returning Inf
3: In max(x) : no non-missing arguments to max; returning -Inf
The error occurs because the vector we want to use for the y-values of the scatterplot contains all characters instead of numeric values.
Solution
We can solve this error by providing a vector of numbers instead of NA values. Let’s look at the revised code:
x<- c(0, 1, 2, 3, 4, 5)
y <- c(3, 6, 7, 8, 14, 19)

plot(x,y)

We successfully created the scatterplot by providing two numeric vectors.
Summary
Congratulations on reading to the end of this tutorial!
For further reading on R related errors, go to the articles:
- How to Solve R Error: $ operator is invalid for atomic vectors
- How to Solve R Warning: longer object length is not a multiple of shorter object length
- How to Solve R Error: Subscript out of bounds
- How to Solve R Error in colSums – ‘x’ must be an array of at least two dimensions
- How to Solve R Error in plot.new(): figure margins too large
For further reading on plotting with R, go to the article:
How to Order Bars in ggplot2 Bar Graph with R
Go to the online courses page on R to learn more about coding in R for data science and machine learning.
Have fun and happy researching!
Suf is a senior advisor in data science with deep expertise in Natural Language Processing, Complex Networks, and Anomaly Detection. Formerly a postdoctoral research fellow, he applied advanced physics techniques to tackle real-world, data-heavy industry challenges. Before that, he was a particle physicist at the ATLAS Experiment of the Large Hadron Collider. Now, he’s focused on bringing more fun and curiosity to the world of science and research online.

