If you want to plot a scatter matrix using Pandas, you have to call scatter_matrix from the pandas.plotting module. If you try to call scatter_matrix from pandas, you will raise the AttributeError: module ‘pandas’ has no attribute ‘scatter_matrix’.
This tutorial will go through the error and how to solve it with code examples.
Table of contents
AttributeError: module ‘pandas’ has no attribute ‘scatter_matrix’
AttributeError occurs in a Python program when we try to access an attribute (method or property) that does not exist for a particular object. The scatter_matrix method is an attribute of the pandas.plotting module, not pandas.
Example
Let’s look at an example where we want to plot a scatter matrix for the features of the Iris dataset. We will import the dataset using Scikit-learn and create a DataFrame, where the columns are the features in the dataset. Let’s look at the code:
from sklearn import datasets
import pandas as pd
import matplotlib.pyplot as plt

iris = datasets.load_iris()
df = pd.DataFrame(iris['data'], columns=iris['feature_names'])
print(df)
Let’s run this part of the program to see what the DataFrame looks like:
sepal length (cm)  sepal width (cm)  petal length (cm)  petal width (cm)
0                  5.1               3.5                1.4               0.2
1                  4.9               3.0                1.4               0.2
2                  4.7               3.2                1.3               0.2
3                  4.6               3.1                1.5               0.2
4                  5.0               3.6                1.4               0.2
..                 ...               ...                ...               ...
145                6.7               3.0                5.2               2.3
146                6.3               2.5                5.0               1.9
147                6.5               3.0                5.2               2.0
148                6.2               3.4                5.4               2.3
149                5.9               3.0                5.1               1.8
Let’s try to plot the scatter matrix:
pd.scatter_matrix(df, alpha=0.2, figsize=(10,10))
plt.show()
---------------------------------------------------------------------------
AttributeError                            Traceback (most recent call last)
Input In [14], in <cell line: 4>()
      1 sepal_length = df.iloc[:,0]
      2 sepal_width = df.iloc[:,0]
----> 4 pd.scatter_matrix(df, alpha=0.2, figsize=(10,10))
      5 plt.show()

File ~/opt/anaconda3/lib/python3.8/site-packages/pandas/__init__.py:261, in __getattr__(name)
    257     from pandas.core.arrays.sparse import SparseArray as _SparseArray
    259     return _SparseArray
--> 261 raise AttributeError(f"module 'pandas' has no attribute '{name}'")

AttributeError: module 'pandas' has no attribute 'scatter_matrix'
We raise the AttributeError because scatter_matrix is under pandas.plotting not pandas.
Solution
To solve this error, we can change the scatter_matrix call so that we import it from the plotting module. Because we already imported pandas as pd and plotting is a pandas module, we just need to change pd.scatter_matrix to pd.plotting.scatter_matrix. Let’s look at the revised code:
from sklearn import datasets
import pandas as pd
import matplotlib.pyplot as plt

iris = datasets.load_iris()
df = pd.DataFrame(iris['data'], columns=iris['feature_names'])
pd.plotting.scatter_matrix(df, alpha=0.2, figsize=(10,10))
plt.show()
Let’s run the code to see the result:
array([[<AxesSubplot:xlabel='sepal length (cm)', ylabel='sepal length (cm)'>,
        <AxesSubplot:xlabel='sepal width (cm)', ylabel='sepal length (cm)'>,
        <AxesSubplot:xlabel='petal length (cm)', ylabel='sepal length (cm)'>,
        <AxesSubplot:xlabel='petal width (cm)', ylabel='sepal length (cm)'>],
       [<AxesSubplot:xlabel='sepal length (cm)', ylabel='sepal width (cm)'>,
        <AxesSubplot:xlabel='sepal width (cm)', ylabel='sepal width (cm)'>,
        <AxesSubplot:xlabel='petal length (cm)', ylabel='sepal width (cm)'>,
        <AxesSubplot:xlabel='petal width (cm)', ylabel='sepal width (cm)'>],
       [<AxesSubplot:xlabel='sepal length (cm)', ylabel='petal length (cm)'>,
        <AxesSubplot:xlabel='sepal width (cm)', ylabel='petal length (cm)'>,
        <AxesSubplot:xlabel='petal length (cm)', ylabel='petal length (cm)'>,
        <AxesSubplot:xlabel='petal width (cm)', ylabel='petal length (cm)'>],
       [<AxesSubplot:xlabel='sepal length (cm)', ylabel='petal width (cm)'>,
        <AxesSubplot:xlabel='sepal width (cm)', ylabel='petal width (cm)'>,
        <AxesSubplot:xlabel='petal length (cm)', ylabel='petal width (cm)'>,
        <AxesSubplot:xlabel='petal width (cm)', ylabel='petal width (cm)'>]],
      dtype=object)
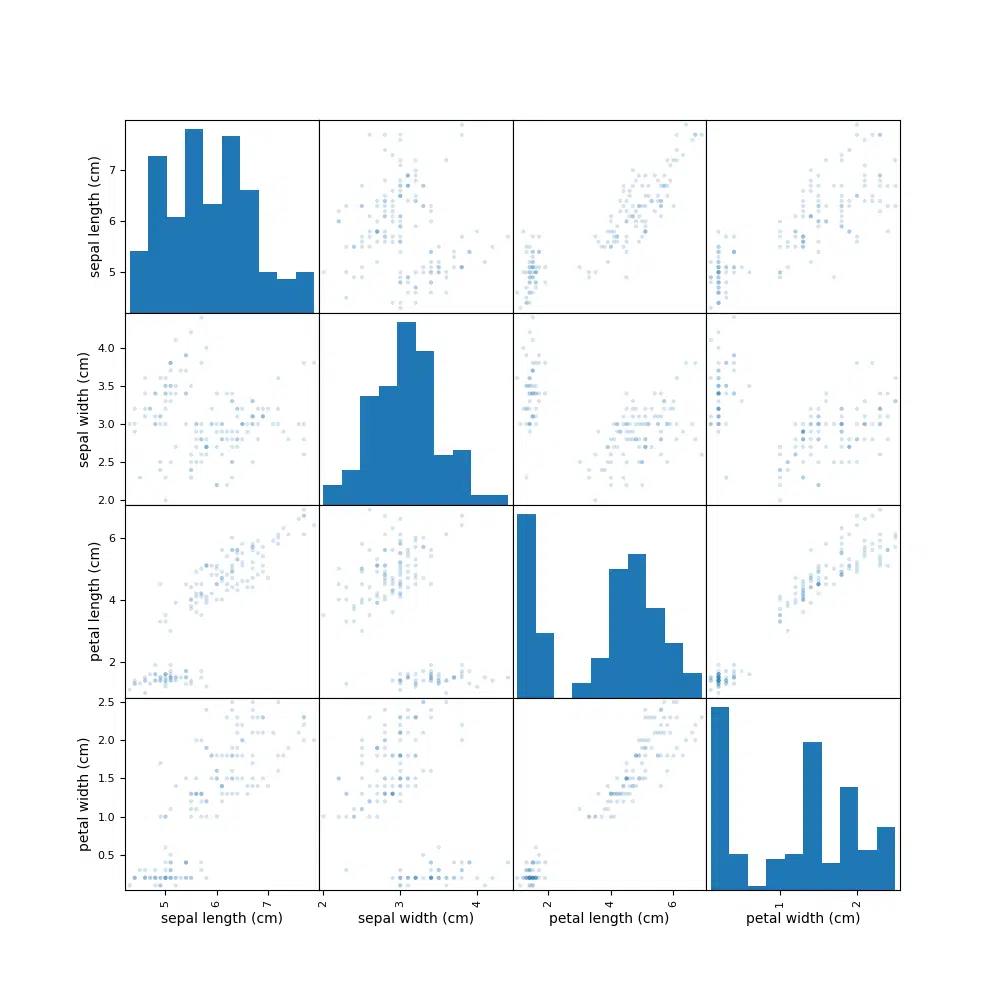
The scatter matrix for the Iris dataset looks like this:
Summary
Congratulations on reading to the end of this tutorial! The AttributeError: module ‘pandas’ has no attribute ‘scatter_matrix’ occurs when you incorrectly import the scatter_matrix method. The scatter_matrix method is under pandas.plotting, not pandas.
For further reading on errors involving Pandas, go to the articles:
- How to Solve Python ValueError: Columns overlap but no suffix specified.
- How to Solve Python TypeError: first argument must be an iterable of pandas objects, you passed an object of type “DataFrame”
For further reading on Pandas, go to the article: Introduction to Pandas: A Complete Tutorial for Beginners.
Have fun and happy researching!

Suf is a senior advisor in data science with deep expertise in Natural Language Processing, Complex Networks, and Anomaly Detection. Formerly a postdoctoral research fellow, he applied advanced physics techniques to tackle real-world, data-heavy industry challenges. Before that, he was a particle physicist at the ATLAS Experiment of the Large Hadron Collider. Now, he’s focused on bringing more fun and curiosity to the world of science and research online.