This error typically occurs when you try to use the state-based interface to Matplotlib called matplotlib.pyplot but do not define the alias plt when importing the API. You can solve this error by using the as keyword to alias the matplotlib.pyplot API, for example:
import matplotlib.pyplot as plt
This tutorial will go through how to solve this error with code examples.
Table of contents
NameError: name ‘plt’ is not defined
Python raises the NameError when it cannot recognise a name in our program. In other words, the name we are trying to use is not defined in the local or global scope. A name can be related to a built-in function, module, or something we define in our programs, like a variable or a function.
The error typically arises when:
- We misspell a name
- We do not define a variable or function
- We do not import a module
In this tutorial, the source of the error NameError: name ‘plt’ is not defined is due to either not aliasing or incorrectly aliasing the numpy module. Let’s look at an example.
Example
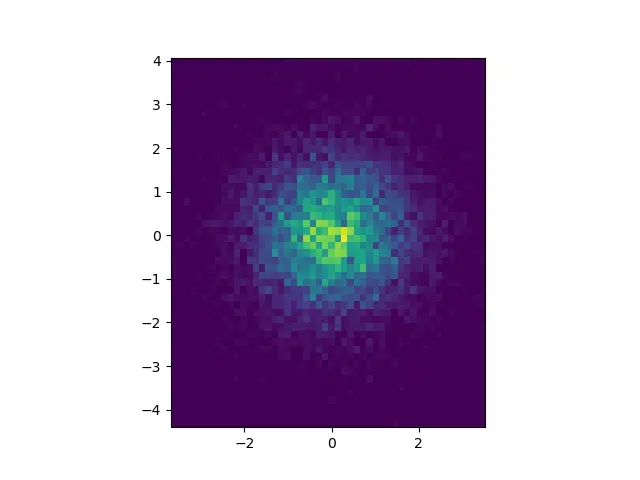
Let’s look at an example of plotting a two-dimensional heatmap using NumPy and matplotlib. First, we must have numpy and matplotlib installed. You can go to the following article to learn how to install numpy and matplotlib for your operating system:
- How to Solve Python ModuleNotFoundError: no module named ‘numpy’.
- How to Solve Python ModuleNotFoundError: no module named ‘matplotlib’
The API pyplot provides a collection of functions for plot manipulation like MATLAB. We can access the pyplot API through the matplotlib module using matplotlib.pyplot.
import numpy as np
import matplotlib.pyplot

# Generate some test data
x = np.random.randn(8873)
y = np.random.randn(8873)

heatmap, xedges, yedges = np.histogram2d(x, y, bins=50)
extent = [xedges[0], xedges[-1], yedges[0], yedges[-1]]

plt.clf()
plt.imshow(heatmap.T, extent=extent, origin='lower')
plt.show()
---------------------------------------------------------------------------
NameError                                 Traceback (most recent call last)
Input In [1], in <cell line: 11>()
      8 heatmap, xedges, yedges = np.histogram2d(x, y, bins=50)
      9 extent = [xedges[0], xedges[-1], yedges[0], yedges[-1]]
---> 11 plt.clf()
     12 plt.imshow(heatmap.T, extent=extent, origin='lower')
     13 plt.show()

NameError: name 'plt' is not defined
The error occurs because we installed matplotlib.pyplot but did not correctly alias the module as plt. Therefore, the name plt is not defined, and we cannot create and show the plot.
Solution #1: Use the as keyword
The easiest way to solve this error is to use the as keyword to create the alias plt. Let’s look at the updated code:
import numpy as np
import matplotlib.pyplot as plt

# Generate some test data
x = np.random.randn(8873)
y = np.random.randn(8873)

heatmap, xedges, yedges = np.histogram2d(x, y, bins=50)
extent = [xedges[0], xedges[-1], yedges[0], yedges[-1]]

plt.clf()
plt.imshow(heatmap.T, extent=extent, origin='lower')
plt.show()
Let’s run the code to get the heatmap:
Solution #2: Do not use aliasing
We can also solve this error by removing the alias and using the module’s full name. Let’s look at the revised code:
import numpy as np
import matplotlib.pyplot

# Generate some test data
x = np.random.randn(8873)
y = np.random.randn(8873)

heatmap, xedges, yedges = np.histogram2d(x, y, bins=50)
extent = [xedges[0], xedges[-1], yedges[0], yedges[-1]]

matplotlib.pyplot.clf()
matplotlib.pyplot.imshow(heatmap.T, extent=extent, origin='lower')
matplotlib.pyplot.show()
Let’s run the code to get the heatmap:
This approach involves duplicate code and can make code less readable. Aliasing is a more concise way of writing code.
Solution #3: Use the from keyword
We can also use the from keyword to import a specific variable, class, or function from a module. In this case, we want to import the clf, imshow and show functions from the pyplot API. Using the from keyword means we do not have to specify the API in the rest of the program. Let’s look at the revised code:
import numpy as np
from matplotlib.pyplot import clf, imshow, show
# Generate some test data
x = np.random.randn(8873)
y = np.random.randn(8873)

heatmap, xedges, yedges = np.histogram2d(x, y, bins=50)
extent = [xedges[0], xedges[-1], yedges[0], yedges[-1]]

clf()
imshow(heatmap.T, extent=extent, origin='lower')
show()
Let’s run the code to get the heatmap:
We can also use the from keyword to import the pyplot API from matplotlib and then alias it using the as keyword. Let’s look at the updated code:
import numpy as np
from matplotlib import pyplot as plt

# Generate some test data
x = np.random.randn(8873)
y = np.random.randn(8873)

heatmap, xedges, yedges = np.histogram2d(x, y, bins=50)
extent = [xedges[0], xedges[-1], yedges[0], yedges[-1]]

plt.clf()
plt.imshow(heatmap.T, extent=extent, origin='lower')
plt.show()
Let’s run the code to get the heatmap.
The import statement from matplotlib import pyplot as plt is equivalent to import matplotlib.pyplot as plt. The latter import statement is preferred among Python developers as it is more concise and readable
Summary
Congratulations on reading to the end of this tutorial.
For further reading on errors involving NameErrors, go to the articles:
- How to Solve Python NameError: name ‘xrange’ is not defined
- How to Solve Python NameError: name ‘os’ is not defined
- How to Solve Python NameError: name ‘pd’ is not defined
Go to the online courses page on Python to learn more about Python for data science and machine learning.
Have fun and happy researching!

Suf is a senior advisor in data science with deep expertise in Natural Language Processing, Complex Networks, and Anomaly Detection. Formerly a postdoctoral research fellow, he applied advanced physics techniques to tackle real-world, data-heavy industry challenges. Before that, he was a particle physicist at the ATLAS Experiment of the Large Hadron Collider. Now, he’s focused on bringing more fun and curiosity to the world of science and research online.