This error occurs when you try to create a line plot using ggplot2 but the x-variable is non-numeric, for example, factor or character.
You can solve this error by using group=1 as an argument in the ggplot() function call, otherwise, you can coerce your x-variable to numeric using as.numeric().
This tutorial will go through how to solve the error with code examples.
Table of contents
Example
Consider the following data frame that contains information about the water level of a pond in centimetres.
df <- data.frame(year=c("1999", "2001", "2003", "2005", "2007", "2009", "2011"),
water_level=c(100, 104, 99, 98, 100, 104, 110))

df
 year water_level
1 1999         100
2 2001         104
3 2003          99
4 2005          98
5 2007         100
6 2009         104
7 2011         110
We will attempt to create a line plot using ggplot2 to show how the water level of the pond fluctuates between 1999 and 2011 in two-year intervals.
library(ggplot2)

ggplot(df, aes(year, water_level)) +
 geom_point() +
 geom_line() +
 ggtitle("Pond water level in centimetres between 1999-2011") +
 theme(plot.title = element_text(size = 8, face = "bold"))
Let’s run the code to see what happens:
geom_path: Each group consists of only one
observation. Do you need to adjust the group
aesthetic?
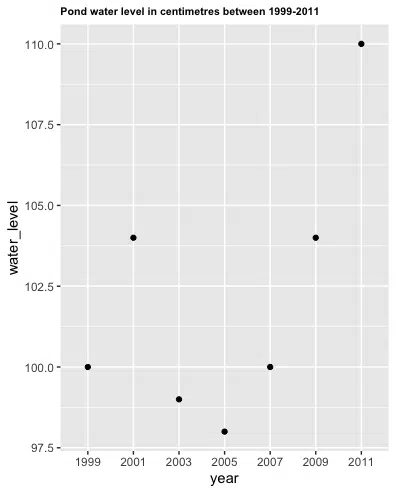
We get a scatter plot and a geom_path error message because a line plot requires a numeric x-variable in order to join the points to form a line.
We provided a character type x-variable, which we can verify using class():
class(df$year)
[1] "character"
Solution #1
We can solve this error by passing group=1 as an argument to the aes() function.
For line graphs, we must group the data points so that R knows which points to connect. In this example, we want to connect all points, therefore group must equal 1.
Let’s look at the revised code
library(ggplot2)

ggplot(df, aes(year, water_level, group=1)) +
 geom_point() +
 geom_line() +
 ggtitle("Pond water level in centimetres between 1999-2011") +
 theme(plot.title = element_text(size = 8, face = "bold"))
Let’s run the code to get the result:
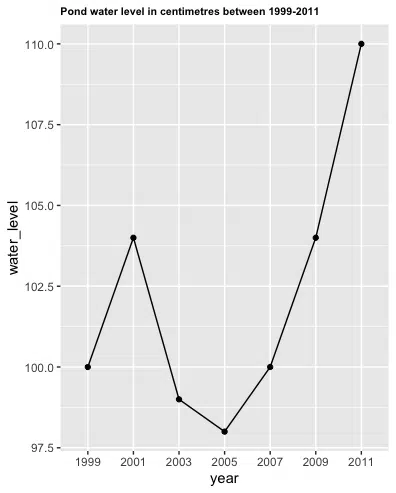
We successfully plotted the water level of the pond between 1999 and 2011.
Solution #2
The second way we can solve this error is to use a numeric x-variable instead of character. We can coerce the year values to numeric using as.numeric(). If the values are numeric we do not need to use group=1. Let’s look at the revised code:
library(ggplot2)

df <- data.frame(year=as.numeric(c("1999", "2001", "2003", "2005", "2007", "2009", "2011")),
water_level=c(100, 104, 99, 98, 100, 104, 110))


ggplot(df, aes(as.numeric(year), water_level)) +
 geom_point() +
 geom_line() +
 ggtitle("Pond water level in centimetres between 1999-2011") +
 theme(plot.title = element_text(size = 8, face = "bold"))
Let’s run the code to get the result:
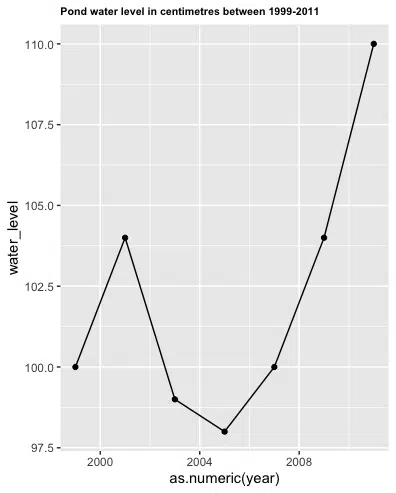
We successfully plotted the water level of the pond between 1999 and 2011.
Summary
Congratulations on reading to the end of this tutorial!
For further reading on errors with R, go to the article:
How to Solve R Error in stripchart.default(x1, …) : invalid plotting method
Go to the online courses page on R to learn more about coding in R for data science and machine learning.
Have fun and happy researching!

Suf is a senior advisor in data science with deep expertise in Natural Language Processing, Complex Networks, and Anomaly Detection. Formerly a postdoctoral research fellow, he applied advanced physics techniques to tackle real-world, data-heavy industry challenges. Before that, he was a particle physicist at the ATLAS Experiment of the Large Hadron Collider. Now, he’s focused on bringing more fun and curiosity to the world of science and research online.