This error occurs if you do not provide a vector or a matrix to the barplot() function.
You can solve this error by ensuring the values you want to plot are in a vector or a matrix. Alternatively, you can use ggplot2 geom_bar() instead of barplot
This tutorial will go through the error in detail and how to solve it with code examples.
Example
Consider a data frame that contains the number of sales of five different types of pizza.
data <- data.frame(pizza= c("margherita", "pepperoni", "four cheeses", "hawaiian", "marinara"),
sales=c(100, 50, 110, 30, 40))
     pizza sales
1   margherita   100
2    pepperoni    50
3 four cheeses   110
4     hawaiian    30
5     marinara    40
We will attempt to visualize the pizza sales as a bar plot.
barplot(data)
Let’s run the code to see the result:
Error in barplot.default(data) : 'height' must be a vector or a matrix
The error occurs because the barplot() function expects either a vector or a matrix, instead it received a data frame. We can verify that the data object is a data frame using the class() function.
class(data)
[1] "data.frame"
Solution #1: Create a named vector
We can solve this error by modifying the input data such that the sales are in a named vector. We can set the names of each element using names(). Let’s look at the revised code.
data_new <- data$sales
names(data_new) <- data$pizza

data_new
Let’s run the code to see the vector.
margherita    pepperoni four cheeses     hawaiian     marinara
         100           50          110           30           40
We can verify the data_new object is a numeric vector using the class() function and is.vector() function
class(data_new)
is.vector(data_new)
[1] "numeric"
[1] TRUE
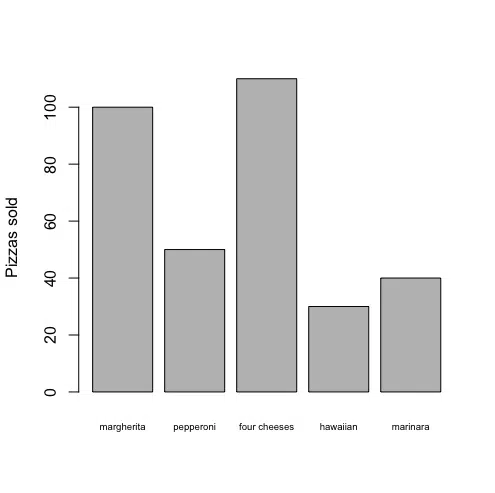
Now we can pass the named vector to the barplot function call as follows:
barplot(data_new, ylab="Pizzas sold", cex.names=0.6)
Let’s run the code to get the plot:
Solution #2: Use ggplot2
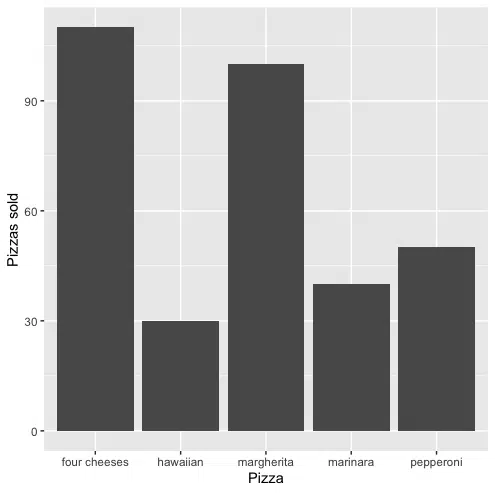
We can also use ggplot2 to plot the barplot, which does not require us to modify the data. In this solution, we need to use geom_bar(). Let’s look at the revised code:
library(ggplot2)

ggplot(data, aes(x=pizza,y=sales)) +
geom_bar(stat="identity") +
labs(x="Pizza", y="Pizzas sold")
Let’s run the code to get the plot:
Summary
Congratulations on reading to the end of this tutorial!
For further reading on R related errors, go to the article:
How to Solve R Error: invalid argument to unary operator
Go to the online courses page on R to learn more about coding in R for data science and machine learning.
Have fun and happy researching!

Suf is a senior advisor in data science with deep expertise in Natural Language Processing, Complex Networks, and Anomaly Detection. Formerly a postdoctoral research fellow, he applied advanced physics techniques to tackle real-world, data-heavy industry challenges. Before that, he was a particle physicist at the ATLAS Experiment of the Large Hadron Collider. Now, he’s focused on bringing more fun and curiosity to the world of science and research online.