This error occurs if you use the aesthetics function aes() in the incorrect place or without the mapping syntax.
You can solve this error either by putting the aes() call inside ggplot2(), for example,
ggplot(gapminder,aes(x=continent, y=lifeExp, fill=continent))
or by using the mapping syntax, for example:
geom_boxplot(gapminder,aes(x=continent, y=lifeExp, fill=continent))
This tutorial will go through the error and how to solve it with code examples.
Table of contents
What is aes in R?
In R, we use aes to generate aesthetic mappings that describe how variables in the data are mapped to visual properties of geoms. A ggplot2 geom tells the plot how we want to display the data in R. For example, geom_bar() makes a bar chart.
Example
Consider the following example, we want to use the gapminder dataset to plot life expectancy across all continents. First, we will install and load gapminder:
install.packages("gapminder")
library(gapminder)
head(gapminder)
# A tibble: 6 × 6
  country     continent  year lifeExp      pop gdpPercap
  <fct>       <fct>     <int>   <dbl>    <int>     <dbl>
1 Afghanistan Asia       1952    28.8  8425333      779.
2 Afghanistan Asia       1957    30.3  9240934      821.
3 Afghanistan Asia       1962    32.0 10267083      853.
4 Afghanistan Asia       1967    34.0 11537966      836.
5 Afghanistan Asia       1972    36.1 13079460      740.
6 Afghanistan Asia       1977    38.4 14880372      786.
Now that we have the dataset, we will attempt to create the life expectancy boxplots.
ggplot() +
   geom_boxplot(gapminder,aes(x=continent, y=lifeExp, fill=continent)) +
   ggtitle("Life Expectancy Across Continents")
Let’s run the code to see what happens:
Error in `validate_mapping()`:
! `mapping` must be created by `aes()`
The error occurs because we passed aes() to the geom_boxplot() function call without specifying that it is the mapping argument.
Solution #1: Use aes in ggplot function call
The conventional way to use aes() is to pass it to the ggplot() function call when initializing a ggplot object. The ggplot() function takes a list of aesthetic mappings to use for plotting as the second argument. Let’s look at the revised code:
ggplot(gapminder,aes(x=continent, y=lifeExp, fill=continent)) +
   geom_boxplot() +
   ggtitle("Life Expectancy Across Continents")
Let’s run the code to see the result:
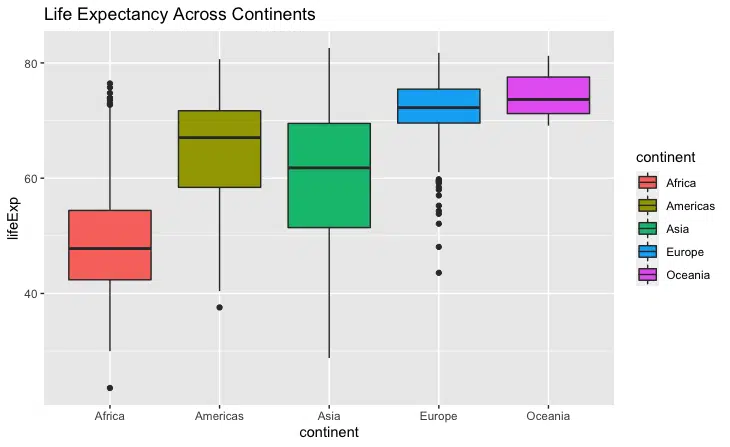
We successfully plotted the box plots for life expectancy across the five continents.
Solution #2: Use mapping Syntax
We can also pass the aesthetic mappings to the geom_boxplot() function but we have to use the keyword mapping. Let’s look at the revised code:
ggplot() +
   geom_boxplot(gapminder,mapping=aes(x=continent, y=lifeExp, fill=continent)) +
   ggtitle("Life Expectancy Across Continents")
Let’s run the code to see the result:
We successfully plotted the box plots for life expectancy across the five continents.
Summary
Congratulations on reading to the end of this tutorial!
For further reading on R related errors, go to the articles:
- How to Solve R Error in sort.int(x, na.last = na.last, decreasing = decreasing, …) : ‘x’ must be atomic
- How to Solve R Warning: NAs Introduced by Coercion
Go to the online courses page on R to learn more about coding in R for data science and machine learning.
Have fun and happy researching!

Suf is a senior advisor in data science with deep expertise in Natural Language Processing, Complex Networks, and Anomaly Detection. Formerly a postdoctoral research fellow, he applied advanced physics techniques to tackle real-world, data-heavy industry challenges. Before that, he was a particle physicist at the ATLAS Experiment of the Large Hadron Collider. Now, he’s focused on bringing more fun and curiosity to the world of science and research online.