This R tutorial will go through how to order bars in a ggplot2 bar chart with code examples.
Table of contents
Example
Consider the following data frame that contains the names and scores of six players of a game.
data <- data.frame("player" = c("Tim", "Rupert", "Celeste", "Jim", "Alia", "Mickey"),
                   "scores" = c(9, 3, 14, 4, 7, 2))

data
 player scores
1     Tim      9
2  Rupert      2
3 Celeste     14
4     Jim      4
5    Alia      7
6  Mickey      2
We want to plot the scores as a bar chart using ggplot2. First, we need to install and load ggplot2 as follows:
install.packages("ggplot2")
library("ggplot2")
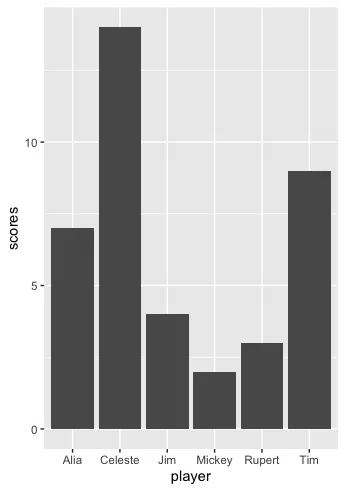
Next, we can create a basic bar chart.
ggplot(data, aes(player, scores)) + geom_bar(stat="identity")
We set the stat parameter to "identity" to tell ggplot2 to skip the aggregation process and that we will provide the y-values. Let’s run the code to see the result.

We successfully plotted the bar chart, but we want to sort the bars in descending order. In other words, the most significant score is closest to the y-axis, and the smallest score is the furthest away from the y-axis.
Solution #1: Manually Order Bars
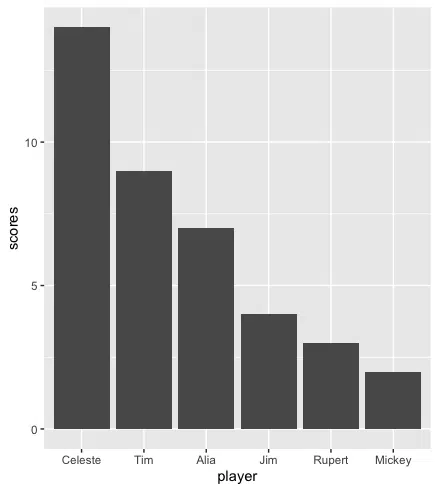
We can manually change the order of the bars by changing the factor levels of the players column. Let’s look at the revised code:
data_clone <- data
data_clone$player <- factor(data_clone$player,
levels = c("Celeste", "Tim", "Alia", "Jim", "Rupert", "Mickey"))
We use the $ operator to select the player column of the data frame. We can then use the same ggplot syntax as before to get the new sorted bar chart.
ggplot(data_clone, aes(player, scores)) +
geom_bar(stat="identity")

Solution #2: Sort Bars in Descending Order
We can sort the bar chart using the order function, which rearranges the provided first argument in ascending or descending order. To sort by descending order, we need to set decreasing=TRUE. By default, the order function has decreasing=FALSE, which sorts in ascending order.
Let’s look at the revised code:
data_clone <- data
data_clone$player <- factor(data_clone$player, levels=data_clone$player[order(data_clone$scores, decreasing=TRUE)])
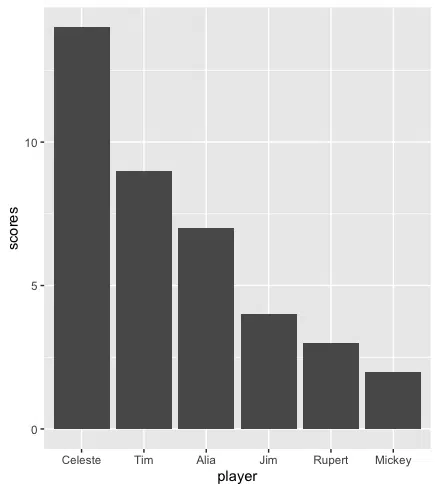
We can then run the code to generate the bar chart:
ggplot(data_clone, aes(player, scores)) +
geom_bar(stat="identity")

We successfully sorted the bar charts in descending order.
Solution #3: Sort Bars in Ascending Order
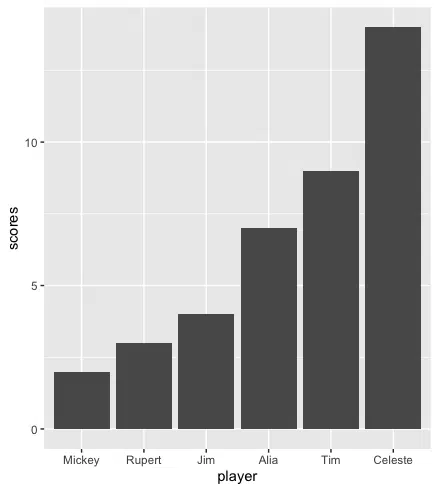
We can use the order function to sort the bar chart in ascending order by leaving the decreasing parameter as its default value. Let’s look at the revised code:
data_clone <- data
data_clone$player <- factor(data_clone_$player, levels=data_clone$player[order(data_clone$scores)])
We can then run the code to generate the bar chart:
ggplot(data_clone, aes(player, scores)) +
geom_bar(stat="identity")

We successfully sorted the bar charts in descending order.
Summary
Congratulations on reading to the end of this tutorial!
For further reading on plotting in R, go to the article:
- How to Place Two Plots Side by Side using ggplot2 and cowplot in R
- How to Remove Outliers from Boxplot using ggplot2 in R
Go to the online courses page on R to learn more about coding in R for data science and machine learning.
Have fun and happy researching!
Suf is a senior advisor in data science with deep expertise in Natural Language Processing, Complex Networks, and Anomaly Detection. Formerly a postdoctoral research fellow, he applied advanced physics techniques to tackle real-world, data-heavy industry challenges. Before that, he was a particle physicist at the ATLAS Experiment of the Large Hadron Collider. Now, he’s focused on bringing more fun and curiosity to the world of science and research online.

