This tutorial will go through how to remove outliers from a boxplot using ggplot2 in R with the help of code examples.
Table of contents
Example
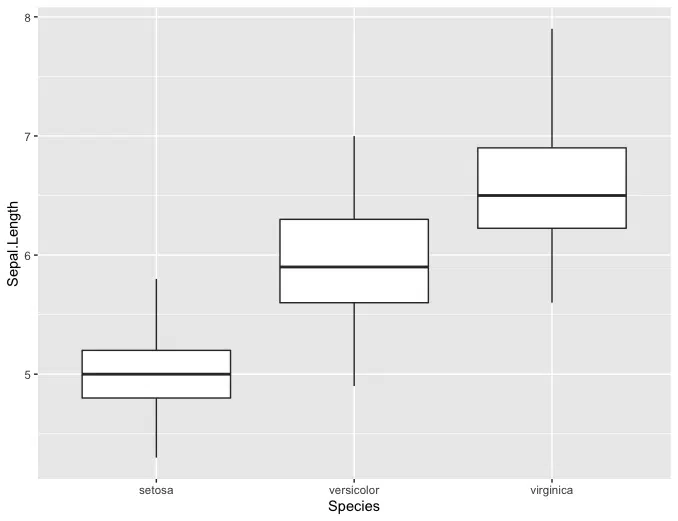
In the following example, we are going to use the iris dataset to create a boxplot.
library(ggplot2)

ggplot(data=iris, aes(x=Species, y=Sepal.Length)) +
    geom_boxplot()

We can see that there is an outlier for the virginica species.
Remove Outlier Using outlier.shape=NA
We can remove the outlier by using the argument outlier.shape=NA in the geom_boxplot() constructor. Let’s look at the revised code:
library(ggplot2)

ggplot(data=iris, aes(x=Species, y=Sepal.Length)) +
    geom_boxplot(outlier.shape=NA)
Let’s run the code to see the result.
We successfully removed the outlier from the boxplot.
Summary
Congratulations on reading to the end of this tutorial!
For further reading on plotting in R, go to the articles:
- How to Place Two Plots Side by Side using ggplot2 and cowplot in R
- How to Rotate and Space Axis Labels in ggplot2 with R
- How to Add Regression Line Equation and R-Squared on Graph using R
Go to the online courses page on R to learn more about coding in R for data science and machine learning.
Have fun and happy researching!

Suf is a senior advisor in data science with deep expertise in Natural Language Processing, Complex Networks, and Anomaly Detection. Formerly a postdoctoral research fellow, he applied advanced physics techniques to tackle real-world, data-heavy industry challenges. Before that, he was a particle physicist at the ATLAS Experiment of the Large Hadron Collider. Now, he’s focused on bringing more fun and curiosity to the world of science and research online.