This error occurs when you try to specify the fill colours when using ggplot2, but the number of colours is not 1 or different from the total number of plots to fill.
To solve this error you can either specify one fill colour argument or ensure the total number of colours matches the number of plots.
This tutorial will go through the error in detail and how to solve it with code examples.
Table of contents
Example
Consider the following example where we want to plot the miles-per-gallon against the number of cylinders from the built-in R dataset mtcars. We will use a box plot to visualize the distribution of miles-per-gallon values as a function of the number of cylinders.
library(ggplot2)

ggplot(data = mtcars, aes(x=as.character(cyl), y=mpg)) +
    geom_boxplot(fill=c('steelblue', 'red'))
Let’s run the code to see what happens:
Error in `check_aesthetics()`:
! Aesthetics must be either length 1 or the same as the data (3): fill
We get the error because we specified two fill colors but there are more than two box plots to fill. We can verify this by looking at the number of distinct values under the cyl column in mtcars:
cylinders <- unique(mtcars$cyl)
num_categories <- length(cylinders)
print(num_categories)
3
There are three distinct values in the cyl column.
Solution #1
We can solve the error by either specifying one fill colour or by matching the exact number of fill colours to the number of plots. First, let’s look at solving the error with one fill colour:
library(ggplot2)

ggplot(data = mtcars, aes(x=as.character(cyl), y=mpg)) +
    geom_boxplot(fill=c('steelblue'))
Let’s run the code to get the plot:
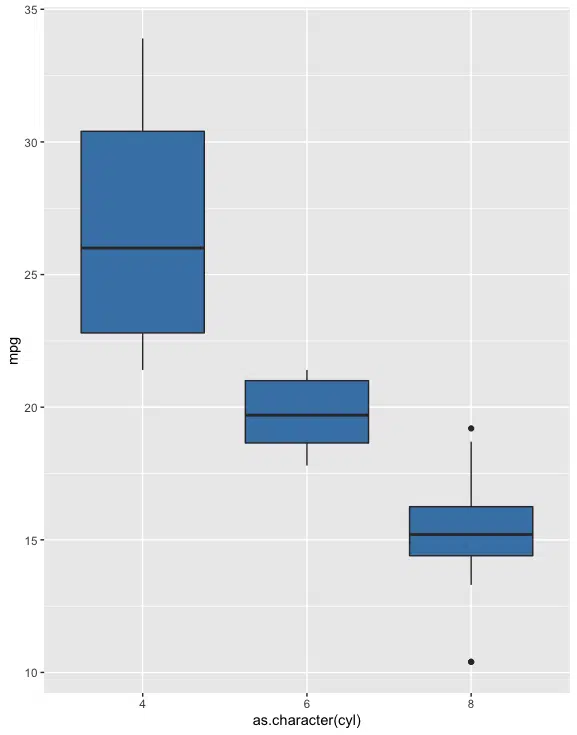
In this case, the box plots share the same fill colour.
Solution #2
Next, we will solve the error by specifying three fill colours.
library(ggplot2)

ggplot(data = mtcars, aes(x=as.character(cyl), y=mpg)) +
    geom_boxplot(fill=c('steelblue', 'green', 'magenta'))
Let’s run the code to get the plot:
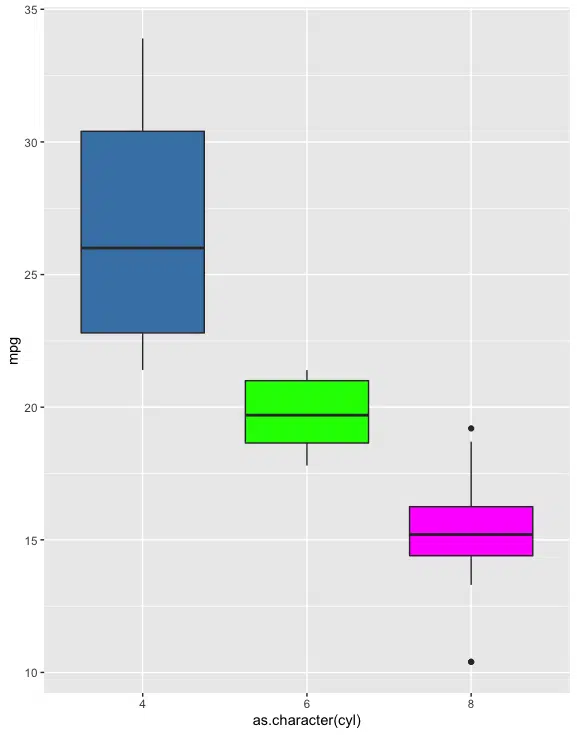
In this case, each box plot has a distinct fill colour.
Summary
Congratulations on reading to the end of this tutorial!
For further reading on R related errors, go to the articles:
- How to Solve R Error: plot.window(…): need finite ‘ylim’ values
- How to Solve R Error in file(file, “rt”) cannot open the connection
- How to Solve R Error: Subscript out of bounds
- How to Solve R error in aggregate.data.frame(as.data.frame(x), …) : arguments must have same length
Go to the online courses page on R to learn more about coding in R for data science and machine learning.
Have fun and happy researching!

Suf is a senior advisor in data science with deep expertise in Natural Language Processing, Complex Networks, and Anomaly Detection. Formerly a postdoctoral research fellow, he applied advanced physics techniques to tackle real-world, data-heavy industry challenges. Before that, he was a particle physicist at the ATLAS Experiment of the Large Hadron Collider. Now, he’s focused on bringing more fun and curiosity to the world of science and research online.