This error occurs if you use a numeric variable for the fill, color, and shape aesthetics in ggplot when it expects a factor variable. You can solve this error by using a factor class variable as the grouping variable. You can convert numeric values to factor using the factor() function.
This tutorial will go through the error in detail and how to solve it with code examples.
Table of contents
Example
Consider a dataset consisting of 500 random values sampled from the normal distribution. Each of the samples falls into one of five catogories.
set.seed(0)
df <- data.frame(x = rnorm(500), category= 1:5)
head(df)
Let’s run the code to see the data frame:
   x category
1  1.2629543        1
2 -0.3262334        2
3  1.3297993        3
4  1.2724293        4
5  0.4146414        5
6 -1.5399500        1
Next, we will attempt to create five box plots to show the distribution of the values within the five data groups.
library("ggplot2")

ggplot(df, aes(x, group = category, fill = category)) +
  geom_boxplot() +
  scale_fill_manual(values = c("magenta", "steelblue",
                               "blue", "purple",
                               "yellow"))
Let’s run the code to see what happens:
Error: Continuous value supplied to discrete scale
The error occurs because the fill argument in the aes() function call expects a factor variable not numeric. We can verify that category is numeric using is.numeric():
is.numeric(df$category)
[1] TRUE
Solution: Use factor() To convert numerical values to factor
We can solve this error by converting the category variable to a factor using the built-in factor function. Let’s look at the revised code:
library("ggplot2")

ggplot(df, aes(x, group = category, fill = factor(category))) +
  geom_boxplot() +
  scale_fill_manual(values = c("magenta", "steelblue",
                               "blue", "purple",
                               "yellow"))
Let’s run the code to get the result:
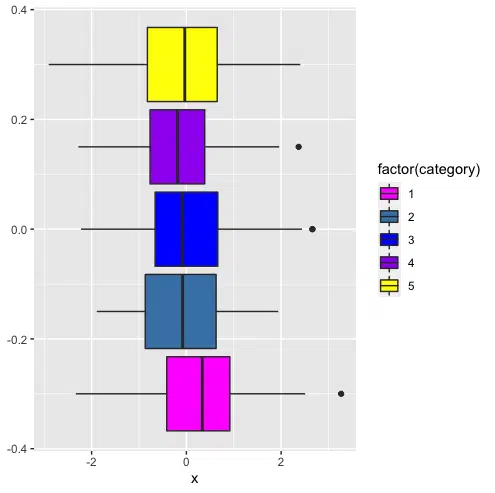
We successfully plotted the five box plots.
Example #2: Default data set example mtcars and ggplot2
Let’s look at an example of plotting three variables from the mtcars dataset. We will attempt to plot miles-per-gallon (mpg) against weight (wt) with the number of cylinders (cyl) as the colour and shape of the points. We will also plot lines of best fit for the three cyl categories (4, 6, 8).
ggplot(mtcars, aes(x=wt, y=mpg, color=cyl, shape=cyl)) +
  geom_point() +
  geom_smooth(method=lm, se=FALSE, fullrange=TRUE)+
  scale_shape_manual(values=c(3, 16, 17))+
  scale_color_manual(values=c('#999999','#E69F00', '#56B4E9'))+
  theme(legend.position="top")
Let’s run the code to see what happens:
Error: Continuous value supplied to discrete scale
The error occurs because the color and shape arguments in the aes() function call need to be factors not numeric.
Solution
We can solve this error by converting cyl from numeric to factor using the factor() function. Let’s look at the revised code:
ggplot(mtcars, aes(x=wt, y=mpg, color=factor(cyl), shape=factor(cyl))) +
  geom_point() +
  geom_smooth(method=lm, se=FALSE, fullrange=TRUE)+
  scale_shape_manual(values=c(3, 16, 17))+
  scale_color_manual(values=c('#999999','#E69F00', '#56B4E9'))+
  theme(legend.position="top")
Let’s run the code to get the result:
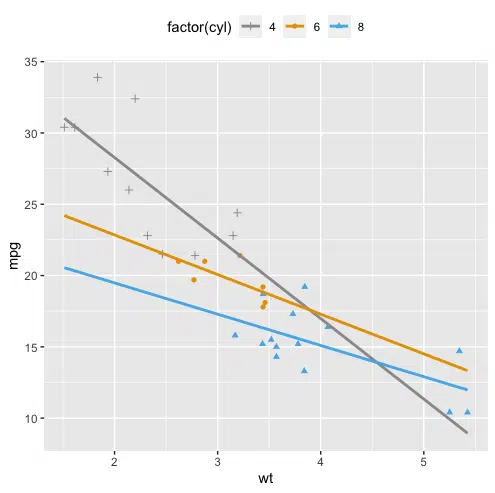
We successfully created the plot.
Summary
Congratulations on reading to the end of this tutorial!
For further reading on R related errors, go to the articles:
- How to Solve R Error: Discrete Value Supplied to Continuous Scale
- How to Solve R Error: plot.window(…): need finite ‘ylim’ values
- How to Solve R Error in file(file, “rt”) cannot open the connection
- How to Solve R error in aggregate.data.frame(as.data.frame(x), …) : arguments must have same length
Go to the online courses page on R to learn more about coding in R for data science and machine learning.
Have fun and happy researching!

Suf is a senior advisor in data science with deep expertise in Natural Language Processing, Complex Networks, and Anomaly Detection. Formerly a postdoctoral research fellow, he applied advanced physics techniques to tackle real-world, data-heavy industry challenges. Before that, he was a particle physicist at the ATLAS Experiment of the Large Hadron Collider. Now, he’s focused on bringing more fun and curiosity to the world of science and research online.