This error occurs you try to set limits on the y-axis using scale_y_continuous() and the y variable is not numeric. This error can happen if you use character or factor type for the y variable in your data. You can solve this error by using numeric values instead of character or factor. Alternatively, you can subset the data frame before plotting the data.
This tutorial will go through the error in detail and how to solve it with code examples.
Table of contents
Example
Consider the following data frame that consists of two variables. The first variable contains 100 numeric values, which are samples from the normal distribution. The second variable consists of four categories. Let’s look at the data frame:
set.seed(0)
data <- data.frame(x = rnorm(100),          # Create example data
                   y = c("0-18", "18-35", "35-45", "45+"))
head(data)
           x     y
1  1.2629543  0-18
2 -0.3262334 18-35
3  1.3297993 35-45
4  1.2724293   45+
5  0.4146414  0-18
6 -1.5399500 18-35
Let’s attempt to plot the data using ggplot2.
library("ggplot2") # load ggplot2 package


ggplot(data, aes(x, y)) +
  geom_point()
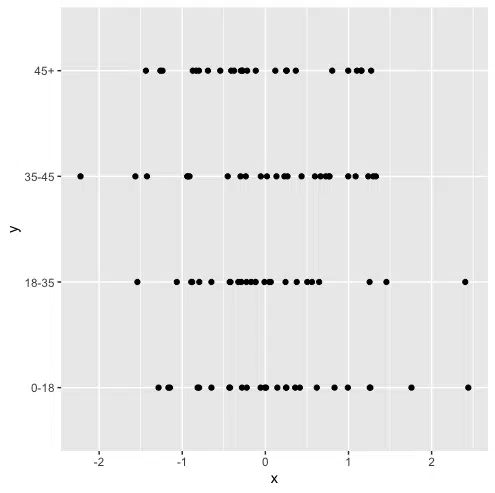
We successfully created a ggplot2 graph showing the example data.
Next, we will try to change the limits on the y-axis using scale_y_continuous(). We want to exclude values that are in the 45+ category. Let’s look at the code:
ggplot(data, aes(x, y)) +
  geom_point() +
  scale_y_continuous(limits = c(0, 45))
Let’s run the code to see what happens:
Error: Discrete value supplied to continuous scale
The error occurs because the y-variable is discrete, and scale_y_continuous() expects a numeric variable to limit.
Solution #1
We can solve this error by preprocessing our data. We can use subsetting to exclude the values that are in the 45+ category. Let’s look at the additional code:
data_new <- data[data$y != "45+", ]
Next, we will plot the data without using scale_y_continuous. Let’s look at the revised code:
ggplot(data_new, aes(x, y)) +
     geom_point()
Let’s run the code to get the result:
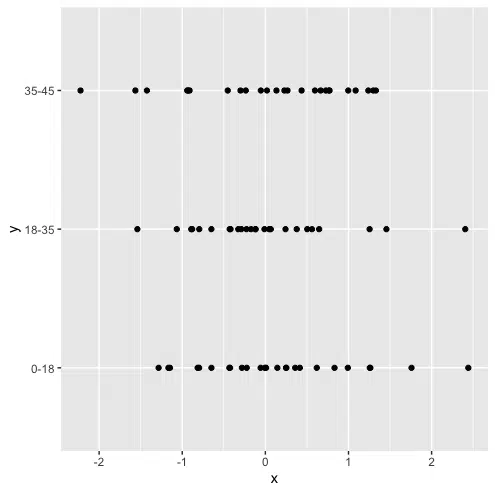
We successfully plotted the data with the values in the 45+ category excluded.
Solution #2
We can also solve this error by using numeric instead of character as the y variable. Let’s look at the revised code:
library("ggplot2")

set.seed(0)
data <- data.frame(x = rnorm(100),
                   y = c(1:4))
head(data)
In the above code, we use a vector of numeric values from 1 to 4 instead of a vector of character values. Let’s look at the data frame:
        x y
1  1.2629543 1
2 -0.3262334 2
3  1.3297993 3
4  1.2724293 4
5  0.4146414 1
6 -1.5399500 2
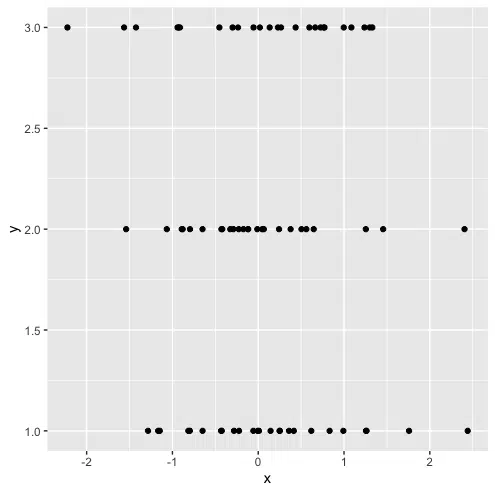
We can now use scale_y_continuous to exclude values that have a y value of 4, which is equivalent to excluding values from the previous data frame with a y value of 45+.
ggplot(data, aes(x, y)) +
     geom_point() +
     scale_y_continuous(limits = c(1, 3))
Let’s run the code to get the result:
Summary
Congratulations on reading to the end of this tutorial!
For further reading on R related errors, go to the articles:
- How to Solve R Error in file(file, “rt”) cannot open the connection
- How to Solve R Error: aesthetics must be either length 1 or the same as the data
- How to Solve R Error: continuous value supplied to discrete scale
- How to Solve R Error: missing values are not allowed in subscripted assignments of data frames
Go to the online courses page on R to learn more about coding in R for data science and machine learning.
Have fun and happy researching!

Suf is a senior advisor in data science with deep expertise in Natural Language Processing, Complex Networks, and Anomaly Detection. Formerly a postdoctoral research fellow, he applied advanced physics techniques to tackle real-world, data-heavy industry challenges. Before that, he was a particle physicist at the ATLAS Experiment of the Large Hadron Collider. Now, he’s focused on bringing more fun and curiosity to the world of science and research online.